We’ve covered how to use the Pingdom Transaction Monitor to keep an eye on logins and form submissions before here on the blog. Today we will take that a step further and look at how you can monitor logins and applications that require basic authentication. We’ll actually present you with two ways of doing this: one using the Transaction Monitor and one using a regular HTTP check.
Using the Transaction Monitor
The Pingdom Transaction Monitor is a powerful way to monitor that multi-step web transactions execute as they should. Many websites and applications today depend on various scripts and pages working in sequence, and just looking at one page is often not enough.
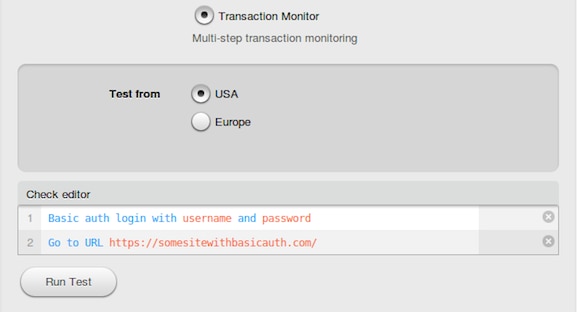
If you want to use the Transaction Monitor to track that logins and applications that require basic authentication work, you just need to add a single line to your recipe.
Simply use the “Basic auth login…” command as the first line, just before the recipe goes to the website. The command needs to be first because the authentication is performed with the server, not the website.
Here’s what it would look like:

Starting on line 3 you can then continue with your recipe.
Using a HTTP check
You can also use a regular HTTP check to monitor something that requires basic authentication. For example, this can be useful if you want to monitor a public API, which often require basic authentication.
The difference compared to the first example is that using the Transaction Monitor you can monitor a sequence of events, what should happen after the login. With the HTTP check you will only find out whether the login worked or not.
To do it this way, you go to the optional settings when editing or creating a check. There, you simply enter the username and password in the designated fields.
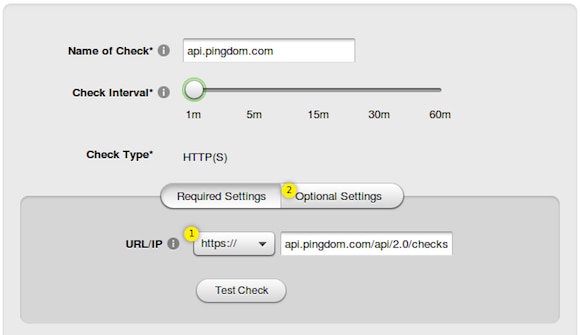
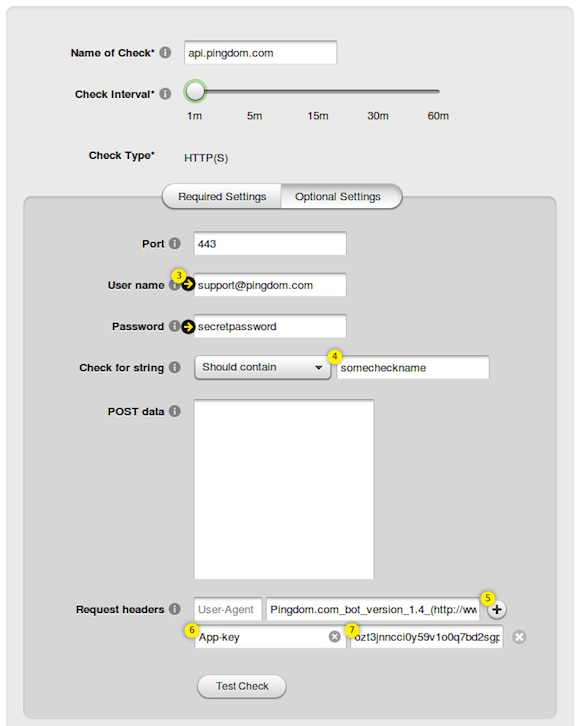
Here’s an example of how you can configure a check to monitor the Pingdom API:
- Enter the URL of the method in the “URL/IP” field.
- Click on “Optional Settings.”

- Enter the credentials (“User name,” and “Password”).
- You should preferably make the check look for something with the “Check for string” function so that you can verify the results of the API request. This is a particular piece of text that should be produced by the API if everything is as it should.
- Add the application key as a custom header by clicking the + sign to the right of “Request headers.”
- Select custom in the drop-down and enter “App-key” in the left field.
- Enter the actual app-key in the right field.

- Set the notification settings you want, save the check and you should be up and running.
Every API and application is different in one way or another so the above example (especially steps 5-7) may not work in your particular case, but hopefully this gives you an idea how to use the optional settings of the HTTP check.
What transactions do you monitor?
If you haven’t tried out Transaction Monitor yet you can do so today by selecting the Check Type “Transaction Monitor” when you create a new check in the My Pingdom control panel. To help you get started, we have a number of articles available for you to look at.
On the other hand, if you’re already using the Transaction Monitor, what are you monitoring? We’d very much like to hear from you. Let us know in the comments below or send an email to press@pingdom.com.


