Being notified by a customer, friend, or someone outside your office that a website is down is, quite frankly, embarrassing. All websites run into trouble from time to time. Murphy’s Law will make sure of that. There are simply too many things that can break a website, from server hardware issues, software issues, coding errors, network downtime, and power outages. The possibilities are, as the saying goes, endless.
It’s probably not even your fault, but here you are, about to save someone’s bacon. Here’s what you can do.
Is the Website Actually Down?
This may be obvious, and a way to toot our own horn, but at SolarWinds® Pingdom® we have uptime monitoring—your first line of defense. Because Pingdom is using more than 70 global test servers, you can truly get an outside perspective on your website—which sure beats refreshing your browser yourself, like an animal. Within a minute, Pingdom will confirm whether your website is down or not.
If the website is down, make sure you sit up straight and keep reading. Oh, and it would be appropriate to pinch the bridge of your nose and exhale for a few seconds—if nothing else than for effect. Let your colleagues know you’re important.
Figure Out What the Problem Is
Too many things can break a website, but usually, it will be one or more of the following reasons:
- Code error
- DNS problem
- Networking issues
- Server issues with your web host
In the Pingdom alert, you’ll find the reason for your outage. It’s time to look at some of the most common reasons websites go down.
HTTP Error 403: Your request was valid, but the server is refusing action. You might not have the necessary permissions for a resource or may need an account of some sort.
Packet Loss: This is a network error that could be related to damaged hardware such as a server, network congestion, or some other hardware/network capacity bottleneck.
HTTP Error 503: Indicates the web server is not available because of scheduled maintenance or because of a temporary overload in traffic. This will likely require help from the hosting provider or your operations team.
HTTP Error 500: The 500 Internal Server Error is a very general HTTP status code that means something has gone wrong on the website’s server, but the server could not be more specific on what the exact problem is.
Redirection Error: This is a 301 or 302 gone bad and occurs when you try to do a redirect to an HTTPS URL, but the SSL certificate for that URL doesn’t match the domain.
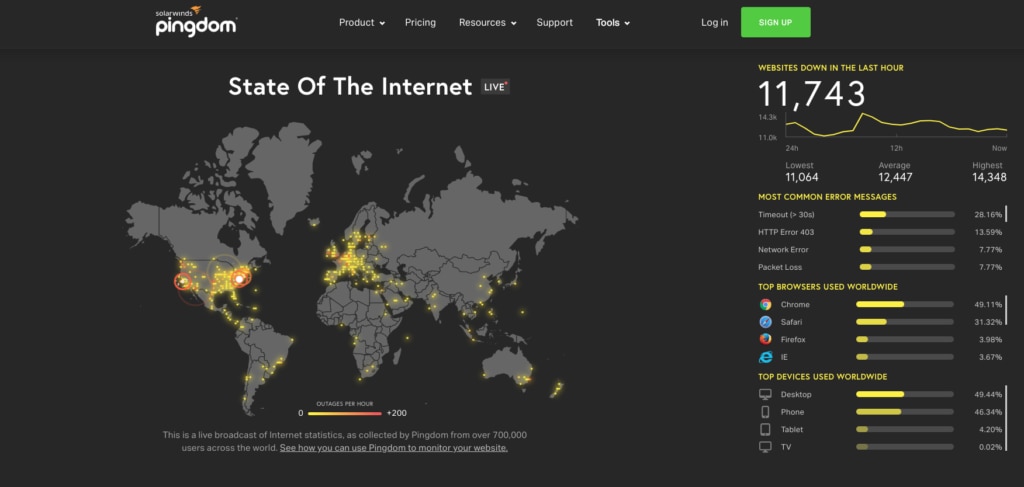
The Pingdom live map allows you to see the state of the internet live as it happens, from how many outages we’ve detected in the last hour and most common error messages to what devices and browsers Internet users are using. This is also an incredibly handy tool when major outages occur from hosting and CDN providers.

Use Your Monitoring Data as Leverage With Your Hosting Provider
Many web hosting companies won’t be upfront about site issues unless you have proof to back it up. If there is no reported status problem with your provider, you can now file a support ticket and use all the relevant monitoring data you have from an independent third-party to prove you have issues.
The sooner you know about a problem, the sooner you can fix it. Conversely, if you don’t know about a problem, you can’t fix it.
Communicate With Your Users Via a Status Page
We cannot overstate the importance of this step. Transparency inspires loyalty, so please consider using a public status page—your users will thank you for it. A public status page is a great way to keep users in the loop of what you’re doing right now and will minimize the impact on your customer support team. And yes, you do have two minutes to log in and update your public status page.
- Get a public status page. Hey you have one through Pingdom, or if you’d like you can try Atlassian Statuspage, SorryApp, or Cachet.
- Update your status page with your relevant status such as ‘investigating’, ‘ongoing’, and ‘resolved’.
- Update Twitter with the ongoing issue and link to your status page.
- Make sure you pin this tweet so it stays clearly visible. This way, your users can see you’re aware of the issues and follow updates on the page. You should never (have to) copy and paste the same tweet over and over to anyone who asks what is going on.
- Many status pages offer users a way to subscribe to updates, so when an issue is resolved your users will get an email notifying them it’s all system go.
Conclusion: Wrap Up
In this article, we merely touched on the surface of what you can do, and being on the lookout for when something goes belly up. However, we only covered a tiny subset of things you can do. If you’re part of an SRE team somewhere, chances are you are already knee-deep in the Apache or Nginx server, fingers sore from writing commands.
Think of website monitoring as affordable insurance against embarrassingly long downtimes. Heck, look at it as your personal watchdog that will bark anytime there is an issue with your website. Only this dog speaks and helps you as a website owner to troubleshoot, and helps keep your web host honest.
When you continuously monitor your website’s uptime and performance, you help make the internet faster and more reliable. Please collect your cape and superhero utility belt on your way out.


