 Sometimes you want an easy way to share your Pingdom monitoring data with others. So far we’ve had public report pages that you can use, but now we’ve added one more sharing method that is very flexible and easy to use.
Enter our new “report banners”.
Shareable report banners
With report banners we have made it easy for you to share uptime and response time stats for any of your monitored sites or servers. You can share them with anyone, regardless if they have a Pingdom account or not.
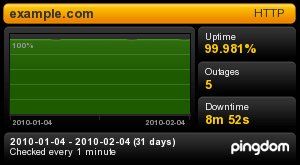
Here is what an uptime banner looks like:

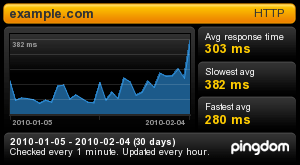
And here is what a response time banner looks like:

There are two types of report banners:
- A “snapshot” banner for any time period of your choosing. It will not change over time.
- A “last 30 days” banner that will update once per hour.
You can create as many banners as you like.
Easy sharing of your monitoring data
The basic concept behind the report banners is to make it easy for you to share your monitoring data with others.
Since the resulting banners are images, you can include them almost anywhere. For example:
- On your website.
- In a blog post.
- In a forum discussion thread.
- In emails to colleagues and friends.
- Anywhere else you can attach or add an image.
Example 1: Imagine you’re speaking to your web hosting provider and want to show them how the response time of your website has deteriorated over the last month. Simply create a report banner that shows the response time for the last month and email it to them. An image often says more than a thousand words.
Example 2: Proudly show your webmaster colleagues or customers that your website has had 100% uptime over the last three months.
We could list hundreds of ways you could use the report banners. The possibilities are virtually endless.
Get started!
Report banners are easily created inside the Pingdom control panel in one of two ways:
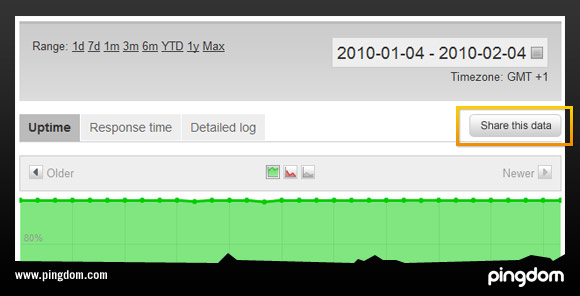
1. Direct buttons in existing reports: You’ll notice that we have added buttons to your uptime and response time report pages, as shown here below. Clicking on the button will automatically create a “snapshot” banner for you for the time period and check you are viewing.

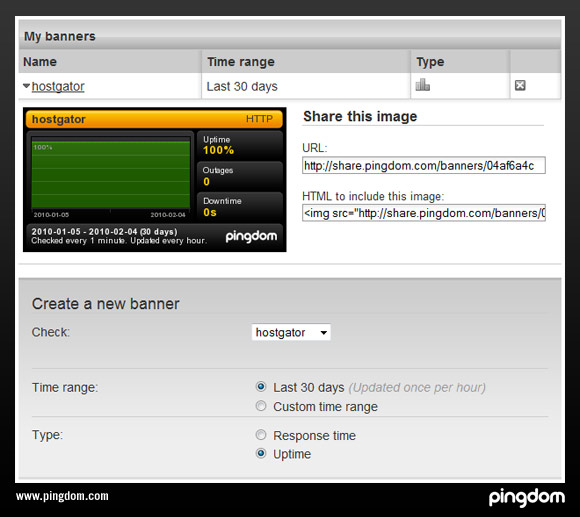
2. The Report Banners page: The other way is to use the Report Banners page to create a banner “from scratch”. On this page you can create either “snapshot” banners or “last 30 days” banners for any of the sites you’re monitoring. It’s still just a few simple clicks and is very easy to do.

We hope you’ll find this feature a useful addition to the Pingdom server uptime monitoring.
(If you don’t already have a Pingdom account, get one for free. That way you can monitor your website and get alerts when it has problems, view uptime and response time reports, get help with troubleshooting, and much more.)


