Synthetic Monitoring

Simulate visitor interaction with your site to monitor the end user experience.

View Product Info

FEATURES

Simulate visitor interaction

Identify bottlenecks and speed up your website.

Learn More

Real User Monitoring

Enhance your site performance with data from actual site visitors

View Product Info

FEATURES

Real user insights in real time

Know how your site or web app is performing with real user insights

Learn More

Infrastructure Monitoring Powered by SolarWinds AppOptics

Instant visibility into servers, virtual hosts, and containerized environments

View Infrastructure Monitoring Info
Comprehensive set of turnkey infrastructure integrations

Including dozens of AWS and Azure services, container orchestrations like Docker and Kubernetes, and more 

Learn More

Application Performance Monitoring Powered by SolarWinds AppOptics

Comprehensive, full-stack visibility, and troubleshooting

View Application Performance Monitoring Info
Complete visibility into application issues

Pinpoint the root cause down to a poor-performing line of code

Learn More

Log Management and Analytics Powered by SolarWinds Loggly

Integrated, cost-effective, hosted, and scalable full-stack, multi-source log management

 View Log Management and Analytics Info
Collect, search, and analyze log data

Quickly jump into the relevant logs to accelerate troubleshooting

Learn More

IE, the office browser – Used significantly less at home

IE logoWe’re going to show you a chart that confirms what some of you already suspected, and Microsoft probably isn’t too happy about. A lot of people only use Internet Explorer because they have to at the office, but at home they use a different web browser.

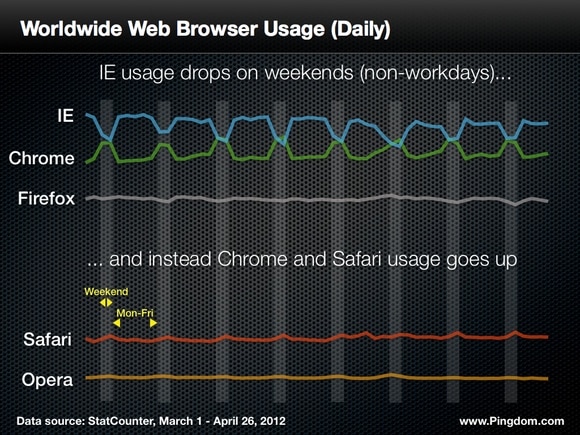
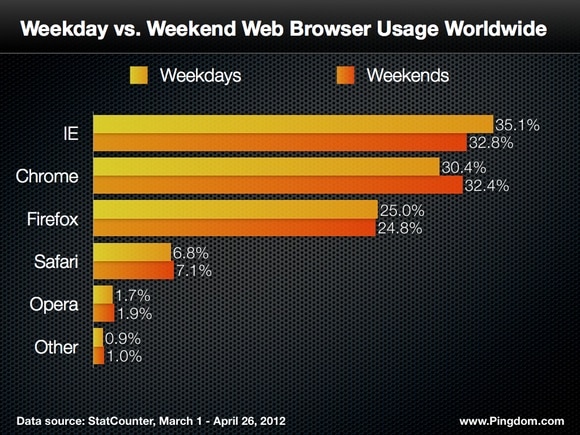
On workdays around 35.1% of all web browsing is done with IE. On weekends that number consistently drops to around 32.8%.

So if IE usage dips every weekend, which browsers do people use instead? For the most part, Google’s Chrome. On weekends, IE and Chrome usage is pretty much neck and neck these days. You could say that for home use, they are now on equal terms.

There are also noticeable increases for Apple’s Safari during weekends, presumably made up of people who use Macs at home and PCs at work. Opera also sees an increase on weekends. We couldn’t find a clear pattern for Mozilla’s Firefox.
ie weekend browser

The above chart shows daily usage, which was the most detailed measurement we could get our hands on.

Worth noting is that if anyone were to make an even more detailed chart completely isolating office hours and at-home hours, the differences seen above would be even more pronounced. As it is now, some home usage is naturally included in the weekday stats.

Still, just dividing weekdays and weekends, we get a clear pattern. Averaging the weekdays and weekends for the period March 1 – April 26 (same as for the first chart), we get the following:
ie weekend vs weekdays

So how about individual countries? As you can imagine, in some countries the pattern is very pronounced, even more so than what you can see here, while in some it’s not quite as noticeable. And in some countries this pattern doesn’t show at all.

The trend when you view the world as a whole, though, is impossible to ignore. If IE’s hold on the workplace were to lessen, it would be in serious trouble. It’s already lost a lot of ground.

Final note: Since this article shows web browser “market share,” some of the increase shown for other browsers is simply an effect of less IE usage.

Data source: StatCounter, based on visitor stats from 3+ million websites.
Introduction to Observability

These days, systems and applications evolve at a rapid pace. This makes analyzi [...]

Webpages Are Getting Larger Every Year, and Here’s Why it Matters

Last updated: February 29, 2024 Average size of a webpage matters because it [...]

A Beginner’s Guide to Using CDNs

Last updated: February 28, 2024 Websites have become larger and more complex [...]

The Five Most Common HTTP Errors According to Google

Last updated: February 28, 2024 Sometimes when you try to visit a web page, [...]

Page Load Time vs. Response Time – What Is the Difference?

Last updated: February 28, 2024 Page load time and response time are key met [...]

Monitor your website’s uptime and performance

With Pingdom's website monitoring you are always the first to know when your site is in trouble, and as a result you are making the Internet faster and more reliable. Nice, huh?

START YOUR FREE 30-DAY TRIAL

MONITOR YOUR WEB APPLICATION PERFORMANCE

Gain availability and performance insights with Pingdom – a comprehensive web application performance and digital experience monitoring tool.

START YOUR FREE 30-DAY TRIAL
Start monitoring for free