When you click on a link in a web browser to go to a web page, a complicated process starts. This process should end in the web page being displayed correctly to you, the visitor. If you’re a webmaster, monitoring this process to see how the performance of your site is affected can be critical to delivering a good user experience to your visitors.
The process of loading a web page consists of separate steps called loading states. In this article, we explain how you can make use of loading states data to speed up your site site using our new Real User Monitoring (RUM) service.
The web page loading process
The key to understanding and making use of the loading states in Real User Monitoring is to understand the loading process of a web page. Let’s look at a simplified overview of what happens:
-
A user clicks on a link or a button, or types in a URL, and hits enter.
-
This sends a request across the Internet to the server on which the website corresponding to the URL is hosted.
-
On the server, the request is processed, and the necessary resources for creating the HTML-file gathered (e.g. from a database.)
-
Once the resources have been gathered, the server sends the HTML to the browser.
-
The browser reads the HTML passed back to it (i.e. parses it), and displays the web page in the browser (i.e. renders it). It now also downloads the other necessary files, like CSS, images, etc.
As mentioned, this is a simplified version of the loading process. For example, dynamic loading of a web page and its content via AJAX can mean that the browser reads pictures and other data during the rendering process and even afterwards.
This may seem complicated but understanding this will help you identify where to start looking for potential performance issues.
Where to find the states information
As soon as you have set up RUM monitoring for your website, Pingdom starts collecting data from all visitors to your site. This information is then organized and aggregated into easy-to-understand charts and graphs, which are available to you in my.pingdom.com.
On the States page for your RUM site you find the loading states data for all the visitors to your site.

First, there’s a chart showing you how the states have performed over time. You can select which time period that is displayed, and you can point to the chart to get further information.
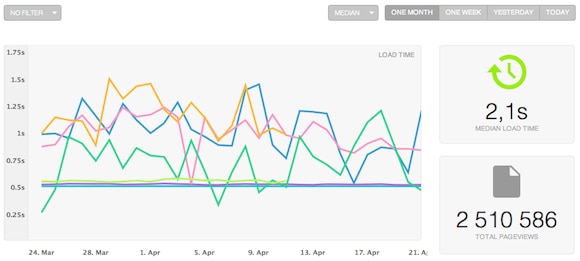
Below this chart, you see three states – Network, Backend, and Frontend – and their respective component states. This is a rather detailed view of the web page loading process described earlier.
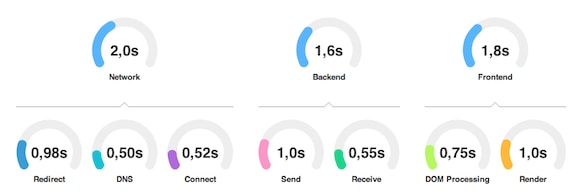
Next, we’ll go over what these mean and how you can use the information they display to make your website faster.
What to do with the states information
Looking at the states can reveal information about the performance of your site.
For example, are the various states of the loading process getting faster or slower? Perhaps there is a sudden change in a particular one, or a long-term change in multiple ones.
In any case, Real User Monitoring will indicate where you should start looking for the cause of the change and here’s how:
Network:
-
If your site has many redirects, can you reduce them or preferably remove them all together?
-
If the DNS state is slow, check your DNS setup. If that doesn’t result in any improvements, consider changing DNS provider.
-
If the Connect state is slow, it’s more than likely due to something going on with your server or its Internet connection. Contact your hosting provider– they should be able to help.
Backend:
-
The Backend state – both Send and Receive – takes place at your hosting provider, with your server talking to other services such as database server.
-
Your first port of call for issues here is to check your own code and change and tweak where possible.
-
You can also try and see if other customers with the same provider if they have similar issues.
-
If you don’t see any improvements after that, contact your hosting provider, like with Connect.
Frontend:
-
Once the browser has received the HTML it reads through the code to figure out how to display it. The DOM (Document Object Model) processing can primarily be speeded up by simplifying your code. Steve Souder’s “14 Rules for Faster-Loading Web Sites” is a good place to start.
-
In the Render stage, the browser takes all the components of the web page (CSS, images, etc.) and displays it for the user.
If your site experiences slowdowns, and you see that one or more states have slowed down, you can use a tool like our Full Page Test to see what resources the browser reads, from where, and how long each takes to download and process.
For more information about Real User Monitoring and loading states, check out this infographic.
Feedback and support
We hope that this has helped you understand how Real User Monitoring can assist you in analyzing how real users experience your site. And when you have such actionable information, you can start to identify the cause of any performance issues.
Of course we welcome your views and suggestions on our Real User Monitoring service. We’re still in the very first stages of an ongoing development process so you have every chance to affect the service going forward.
If you have any comments or questions about RUM or our end user experience or any other Pingdom service, you can reach us at support.pingdom.com.
