Thank you for all the great comments we’ve received about our Real User Monitoring (RUM) service, which we released a week ago. Judging from the amount of RUM-related data that is coming in to our systems, you’re busy adding this new monitoring service to your websites. Hopefully you are also busy using the easy to understand charts available in RUM to analyze your site so you can make it faster and more reliable.
You can find all our RUM-related information here, but we wanted to point out a few articles in case you missed them.
If you have not yet taken RUM for a spin, remember that it is available on all our plans, including the free one. To get started just log in to my.pingdom.com and click on RUM in the menu bar. From there, click on Add New Site and follow the instructions.

Here are the articles we’d recommend that you read to learn more about Real User Monitoring:
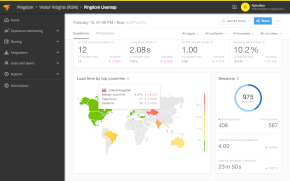
Pingdom’s Real User Monitoring: This is the place to start if you want to find out more about our RUM service. It will give you an overview of the service, highlight some of its features, as well as point out what benefits it can offer you.
Pingdom launches Real User Monitoring service – now available on all new plans: This was our announcement when we launched RUM. It has a good overview of Real User Monitoring and what it can offer you. There is also a video in this post where we talk about RUM.
Understanding loading states in real user monitoring: When you click on a link in a web browser to go to a web page, a complicated process starts. This process should end in the web page being displayed correctly to you, the visitor. If you’re a webmaster, monitoring this process to see how the performance of your site is affected can be critical to delivering a good user experience to your visitors. The process of loading a web page consists of separate steps called loading states. In this article, we explain how you can make use of loading states data to speed up your site site using our new Real User Monitoring (RUM) service.
Expose your website’s performance long tail with real user monitoring: Every visitor will have a different experience of your website. Depending on where they are, what device they use, what kind of connection they use, etc. Do you know how the page loads of your website are distributed among its visitors? If not, real user monitoring can show you how fast the site loads for all visitor. This includes everything from the users for which the site loads the fastest to the long tail of users that see slower loads. In other words, the long tail of load times for your site is worth money.
Real user monitoring helps Geekzone stay streamlined: A case study of sorts of Geekzone.co.nz, a website in New Zealand, and how it has tackled some performance problems by using our RUM service. Geekzone attracts somewhere around 500,000 unique visitors per month and has to deal with many of the same performance and reliability issues that you do. They found, “Pingdom’s RUM confirmed to us that every change we put in place, as little as they may seem, brings some reward in terms of speed. When put together is a huge gain for our users.”
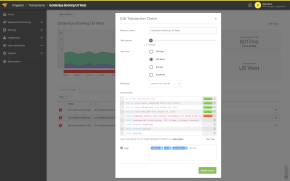
Why you want to have synthetic and real user monitoring: Real User Monitoring is the best way to measure web performance, and synthetic monitoring is most appropriate for knowing whether a site is up or down. Add to that our Transaction Monitor, which can help you make sure a multi-step function is working as it should. Using the three together, means you are well prepared to deliver a great experience to the visitors to your website.
Highlights from the W3C web performance workshop: We participated in a W3C web performance workshop in November last year, together with representatives from Akamai, Google, Microsoft, and many others. Many of the most recent developments in web performance were presented and discussed, including the Beacon API and Client Hints header.
The road to RUM (infographic): As a part of our trip to the W3C workshop we created this infographic about one of the technologies underlying RUM, the Navigation Timing specification. The infographic shows you how this specification has developed as well as an overview of how it currently works.
Feedback and support
Of course we welcome your feedback on our Real User Monitoring service. We’re also here to Pingdom Support with any concerns of questions you may have.


