Synthetic Monitoring

Simulate visitor interaction with your site to monitor the end user experience.

View Product Info

FEATURES

Simulate visitor interaction

Identify bottlenecks and speed up your website.

Learn More

Real User Monitoring

Enhance your site performance with data from actual site visitors

View Product Info

FEATURES

Real user insights in real time

Know how your site or web app is performing with real user insights

Learn More

Infrastructure Monitoring Powered by SolarWinds AppOptics

Instant visibility into servers, virtual hosts, and containerized environments

View Infrastructure Monitoring Info
Comprehensive set of turnkey infrastructure integrations

Including dozens of AWS and Azure services, container orchestrations like Docker and Kubernetes, and more 

Learn More

Application Performance Monitoring Powered by SolarWinds AppOptics

Comprehensive, full-stack visibility, and troubleshooting

View Application Performance Monitoring Info
Complete visibility into application issues

Pinpoint the root cause down to a poor-performing line of code

Learn More

Log Management and Analytics Powered by SolarWinds Loggly

Integrated, cost-effective, hosted, and scalable full-stack, multi-source log management

 View Log Management and Analytics Info
Collect, search, and analyze log data

Quickly jump into the relevant logs to accelerate troubleshooting

Learn More

How We Used Visitor Insights to Fix Performance Issues on Our Own Site

Yesterday we had a close shave on our own site as we prepared to welcome the world to try Visitor Insights for themselves. This turned out to be a blessing in disguise and a perfect way to put Visitor Insights through its paces.

You may have already heard the news but we’re at AWS: reInvent in Las Vegas to demo Visitor Insights: our next generation user experience monitoring tool that bridges the gap between website performance and visitor experience.

Put simply, it can help show you how changes in your site performance affects how your visitors’ experience your site.

“Pingdom, this is Houston, what’s up?”

On Monday evening and Tuesday morning, we saw a spike in the load time for pingdom.com, in some instances increases of over 300% – yikes!

Even with the degraded performance, our site never actually went down, meaning that if all we had was an uptime check monitoring it, we wouldn’t have found out about this until visitors pointed it out to us.

But we had set up a threshold alert available using our own Pingdom monitoring to notify us if our page load speed exceeded our satisfaction parameters. This is how we first became alerted to our website’s slow performance.
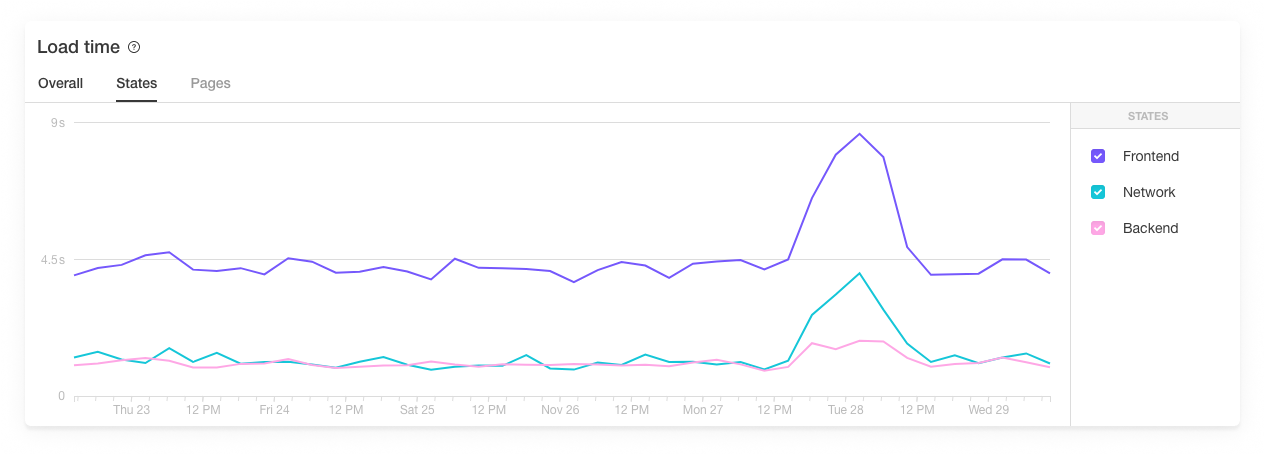
That spike does not look good.

With Visitor Insights, we could confirm at a glance that our website’s load time had increased and that the culprit was network, and most likely that caused frontend to spike as well. We also discovered that we had connectivity issues and wasn’t before long that we narrowed in on a bug in our load balancer.

Pageviews graph from Visitor Insights inside the Pingdom dashboard.

What also became apparent, and honestly something we always wanted Visitor Insights to help prove, was that our pageviews dropped significantly during this temporary performance degradation. In the graph above you can see how the significant increase in load time correlate with pageviews plummeting. Yikes indeed.

Fixing the issue

Using the data collected by Visitor Insights, we were able to kill two birds with one stone: we fixed the bug in the load balancer that had resulted in every other request timing out – good times! But also noticed that our fancy new images weren’t compressed, which we remedied at once.

With our engineers on the job, we managed to right any wrongs here in Sweden well before anybody was up and about at AWS in Las Vegas. Phew!

Introduction to Observability

These days, systems and applications evolve at a rapid pace. This makes analyzi [...]

Webpages Are Getting Larger Every Year, and Here’s Why it Matters

Last updated: February 29, 2024 Average size of a webpage matters because it [...]

A Beginner’s Guide to Using CDNs

Last updated: February 28, 2024 Websites have become larger and more complex [...]

The Five Most Common HTTP Errors According to Google

Last updated: February 28, 2024 Sometimes when you try to visit a web page, [...]

Page Load Time vs. Response Time – What Is the Difference?

Last updated: February 28, 2024 Page load time and response time are key met [...]

Monitor your website’s uptime and performance

With Pingdom's website monitoring you are always the first to know when your site is in trouble, and as a result you are making the Internet faster and more reliable. Nice, huh?

START YOUR FREE 30-DAY TRIAL

MONITOR YOUR WEB APPLICATION PERFORMANCE

Gain availability and performance insights with Pingdom – a comprehensive web application performance and digital experience monitoring tool.

START YOUR FREE 30-DAY TRIAL
Start monitoring for free