Uptime checks on the web tell you if a single page is loading correctly and how long it takes. It’s a good start, but users often interact with many pages, going through complete transactions. For example, they might check out in an e-commerce store, book a hotel room, or publish a blog article. A break in any one of those steps leaves customers unable to use your service. To get a deeper look at the user experience, you need to monitor complete transactions.
In this article, we’ll show you how to continuously monitor transactions made of multiple steps. You’ll learn how to trace them from the front-end user interface all the way to your back-end infrastructure. You’ll see how to identify which step is causing errors and how to optimize performance.
What’s a Transaction?
You complete transactions every day even if you’re not aware of it. For example, when you make a purchase from an online web store, you must go through several steps including adding the item to your cart, adding your mailing address and payment information, and confirming the order. If any of those steps fails, then you cannot purchase the item.
In computer science, a transaction is an abstract concept for a set of operations that are performed together as a unit. If any single step in the set of operations fails, then the entire transaction fails. Likewise, every step must succeed for the transaction to succeed.
The ability for customers to complete transactions is essential for businesses to succeed. If customers cannot make purchases through the store because of errors in a step or if it takes too long to load, then it could negatively affect the store’s revenue and profits. That’s why transaction monitoring is so important.
So What Is Transaction Monitoring?
You can monitor a transaction in several ways. First, you can observe actual transactions that are happening on your website and track statistics about what percentage are completing successfully, and how long they take. When you notice a drop in your success rate, you need to determine if it’s because the site is broken or if it’s just because you’re out of inventory, a promotion ended, and so on. An error or log monitoring solution will tell you about broken services.
The second way to monitor transactions is to synthetically simulate them. You could have a computer process that attempts to purchase an item from the store automatically and on a regular schedule. This will tell you whether transactions are failing due to a technical problem.
When you monitor transactions, you get several useful pieces of information. You can see the overall success rate and how long the transaction took to process. You can also time each step to see which is performing the slowest. Additionally, you can track this information both on the front end from the user’s perspective, and from the back end as your infrastructure processes the transaction. On the back end, this is also called “distributed tracing,” because you want to trace all the steps as they are processed across your infrastructure, even if it’s distributed between multiple services.
For example, let’s say the user tries to book a hotel room online. To the user, that looks like a single action. However, on the back end, there are several steps the system is performing. The system needs to verify you are signed in, check whether the room type is available, reserve that room while you check out, calculate the pricing and apply any discounts, and more. This likely requires interacting with several back end services, including services in charge of user information, room reservations, pricing, and more. Each of those service calls should be monitored for success and time to complete. If the user waits so long that they abandon their session, you can look to see exactly which service was responsible.
How to Monitor Transactions Using Pingdom
SolarWinds® Pingdom® is more than just an availability or uptime checker tool. It can monitor transactions with multiple steps as well. It does so by simulating the entire sequence of steps a user goes through and tracks whether they complete successfully.
Let’s look at an example with a hotel booking website. Let’s try to book a room at the Ritz in Paris for the weekend (oh là là)! We select the hotel, then select the type of room we are interested in, and then we get an ugly error message! I could easily book this room on booking.com instead, which means revenue lost for our site. This is exactly the kind of transaction we want Pingdom to monitor, so we’ll know immediately when there is a problem.


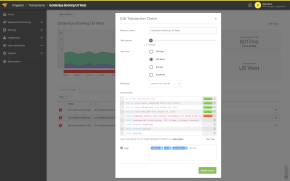
Pingdom can monitor these transactions by configuring a set of steps to be performed in the webpage, along with a validation rule that will tell us whether it succeeded. Below, you can see a root cause analysis report for a transaction I’ve configured. You can see each of the steps that it is performing, including loading the webpage, clicking on the Ritz, and checking out. However, it knows the transaction is failing because it contains the error message “something went wrong”.
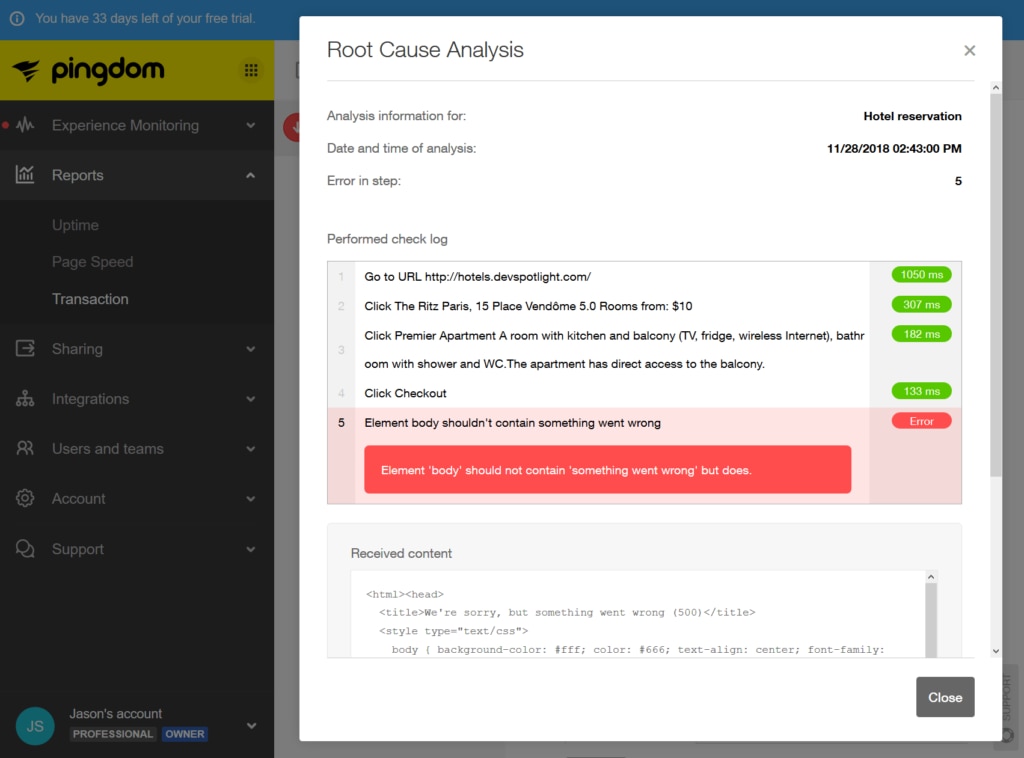
Perhaps some people think ignorance is bliss, but not me. I’m incredibly curious why something went wrong. If I’m responsible for operating this website, it’s more than curiosity. You can bet my boss will be on my case, too! Let’s dive a little deeper to find what happened in our backend infrastructure.
Dive Deeper by Tracing Errors in SolarWinds AppOptics
SolarWinds AppOptics® is an application performance monitoring and infrastructure monitoring tool (that’s a mouthful)! Basically, it hooks into applications and can monitor the transactions being executed in real time. In the screenshot below, you can see that it has automatically identified several smaller transactions that occur within the code. I can see that purchasecontroller.new has an error rate of 100%! Want to bet that’s what is failing when I try to purchase a room?
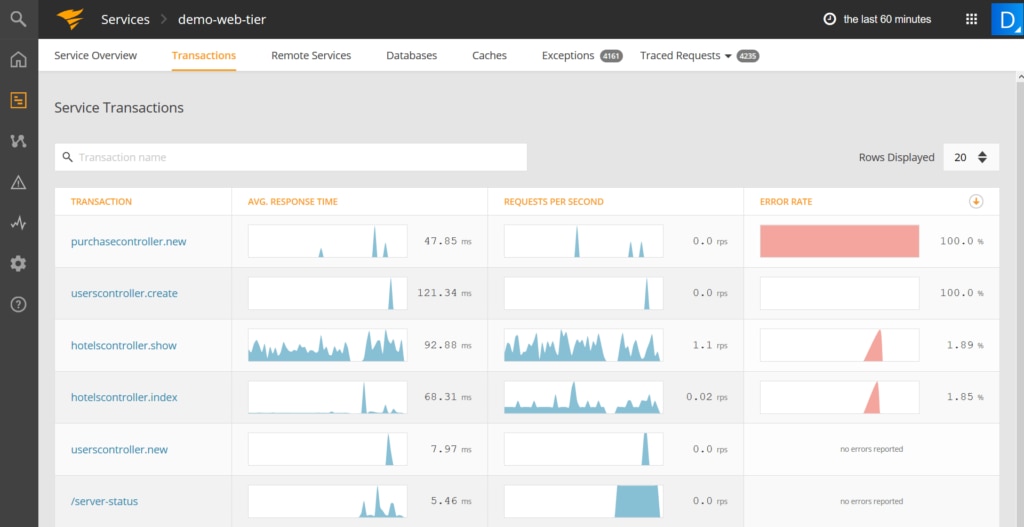
I can click on that transaction to get more details about it. Specifically, I want to see a trace of the transaction executing on the backend. That will tell me more details about what caused the error.
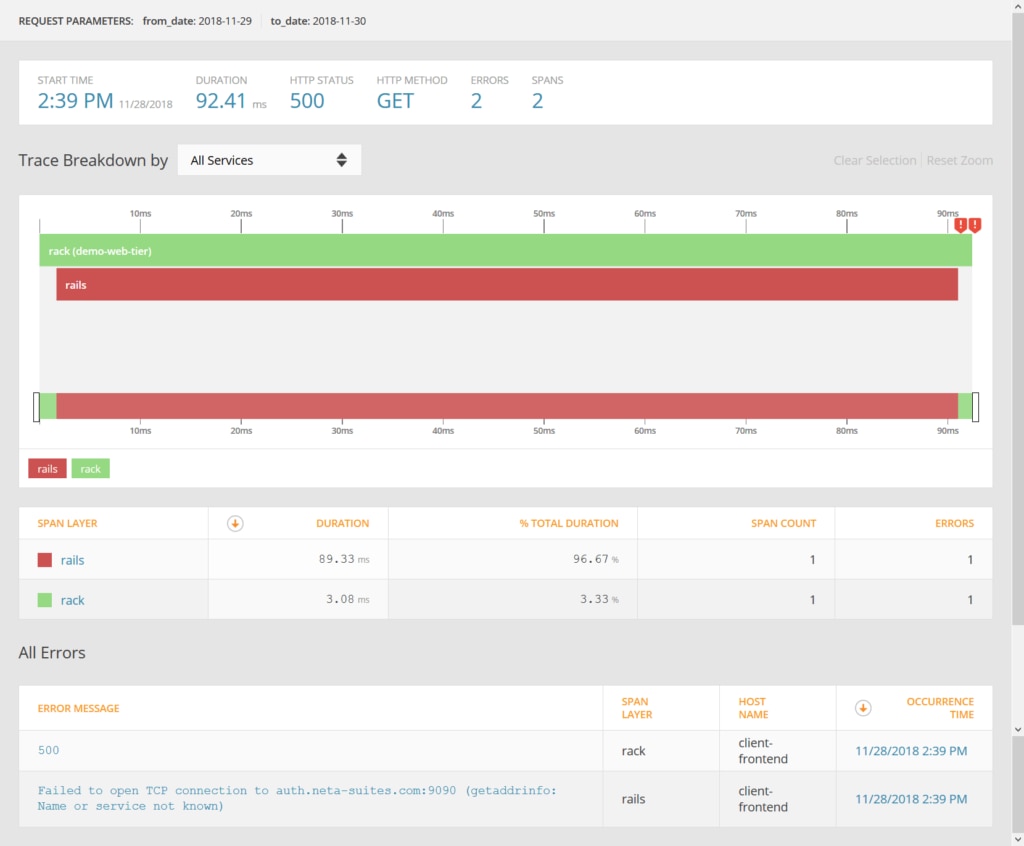
Now I can see the error message at the bottom, which says “Failed to open TCP connection to auth.neta-suites.com:9090 (getaddrinfo: Name or service not known)”. It looks like the DNS entry for the authentication service is missing. This could be because the service is not running or because it was not set up correctly.
This trace was abnormal because there is an error message thrown, so it was very short. It only took about 90 milliseconds to fail. Now, let’s look at a transaction with multiple steps to see if we can improve it.
Optimize Transaction Performance
World travelers who fly to Paris and stay at the Ritz aren’t going to wait around for a slow website. Plus, the longer we spend executing requests, the more we must spend on infrastructure, which eats into our profit margin. Let’s take a look at how fast we respond with the hotel details page. We can use distributed tracing to identify how long each step took to process.
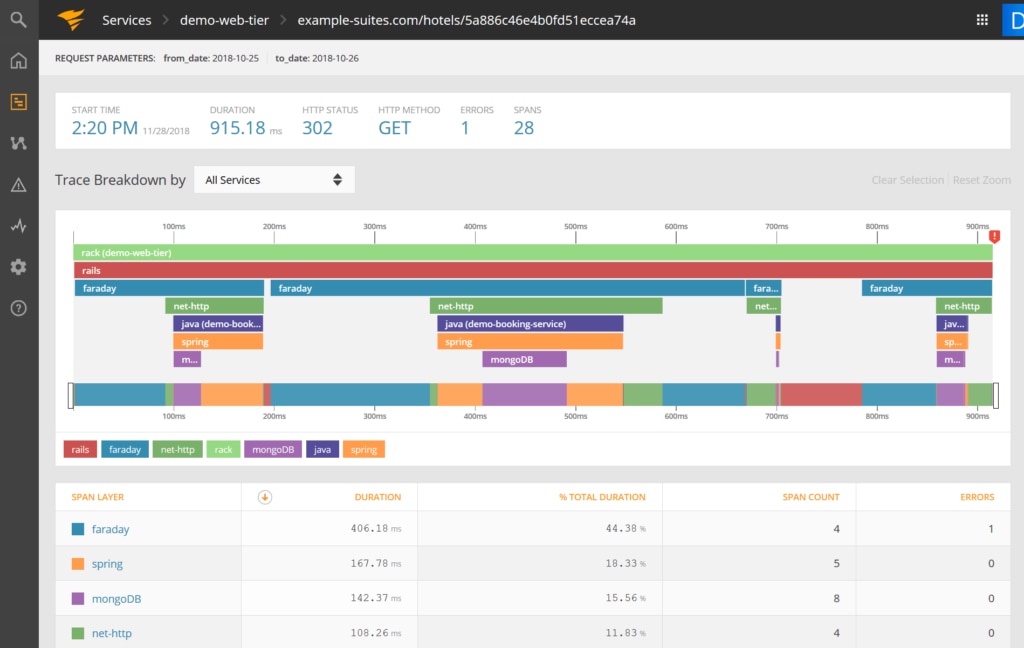
Above, we can see each step that is executed as we load the hotel details page. The total duration was 915 milliseconds, which is slow when you multiply by thousands of page views. Looking at the trace breakdown, we can see that it is a Rack application (shown as the green line) running on Ruby on Rails. Faraday is an HTTP client library that calls the booking service, which is a Java Spring application. The booking service then loads the hotel details from the MongoDB database. It does this a few times since it first loads the hotel data, and then data for each room type.
If we were looking to improve our application performance, one way to do so might be to batch requests in a single database query instead of making several independent requests. This is also known as the database n+1 problem. Querying each room type independently requires multiple calls to the database, which also results in multiple calls through our service stack. If we loaded all the room types in a single query, we could reduce our latency by about 40%. One simple change to my query can improve the performance of the application, and thus our infrastructure cost and the customer experience as well.
Without transaction tracing, I would look at the latency of each call and my metrics or log files independently. I would see that sometimes my MongoDB queries complete very fast, like the third one which was probably cached. Looking at each of these calls independently doesn’t give me much insight. However, looking at a holistic view across the entire transaction makes it clear that the extra calls add a lot of unnecessary time to the request. You can only optimize what you see, and AppOptics shows you the whole picture.
Conclusion
Uptime checks are a start for monitoring your site’s availability. However, the ability to track transactions gives us much deeper insights into problems that affect users. To monitor whether customers can make purchases, we can monitor each step in the transaction using Pingdom.
When there is a problem due to errors or latency, we can use tools like AppOptics to see exactly where the problem lies in our backend infrastructure. It gives us a holistic picture across all the steps so we can fix bugs and optimize the system. This is much more powerful than looking at individual metrics or log statements. If you don’t have transaction tracing for your online services, consider signing up for a free trial of Pingdom or AppOptics from SolarWinds today.
