Imagine this scenario: You have just received an alert that your site is down and you log in to your Pingdom account to figure out what’s up (or down, in most cases). There you can see that your site is still down, and you now need to figure out what’s gone wrong.
Fear not, because that’s where the Root Cause Analysis comes in. It offers a set of diagnostic tools, which can help you figure out what caused an outage. In this article, we show you where you can find the Root Cause Analysis, and how to use it.
What is a Root Cause Analysis?
A while ago we published a blog post entitled “Pingdom says my site is down, but it is not.” In the post we gave you some suggestions for what you can do when you receive a Pingdom alert about your site being down, but you feel your site is up and running.
In this article we will take that a step further by looking at how you can use what’s called Root Cause Analysis in my.pingdom.com to figure out what happened when you’re alerted about downtime.
A Root Cause Analysis is triggered and performed after a downtime is detected and confirmed by Pingdom’s monitoring network. The Root Cause Analysis collects data that can help in finding the cause of an outage.
Equipped with the information in the Root Cause Analysis and some basic knowledge of how a connection between devices on the Internet is established, the information can be used to determine where the error occurred. You could get help with answering questions like: Was the downtime due to DNS problems? Hosting problems? Or simply connectivity issues? This can often be answered using the Root Cause Analysis.
Where do you find the Root Cause Analysis?
To find the Root Cause Analysis, log in to your account in my.pingdom.com and follow the steps below:
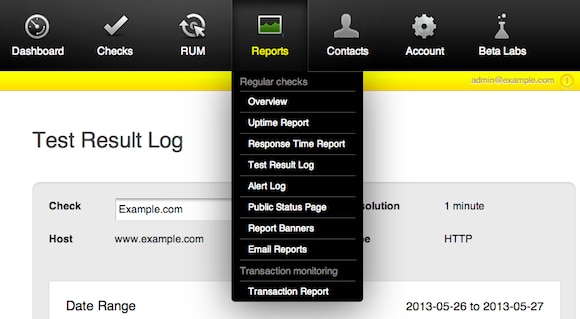
- In the menu “Reports,” click on “Uptime Report.”
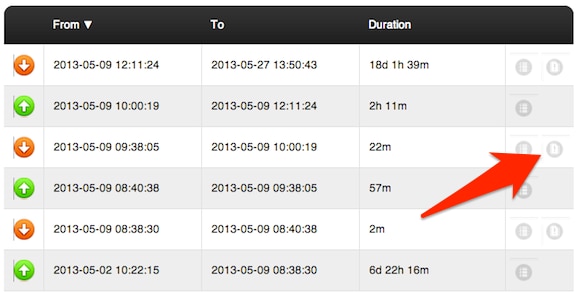
- Find the outage that you are interested in. Once you have found this outage, click the “Root Cause Analysis” button (see the exclamation mark icon below) next to the outage to open the Root Cause Analysis for that outage.
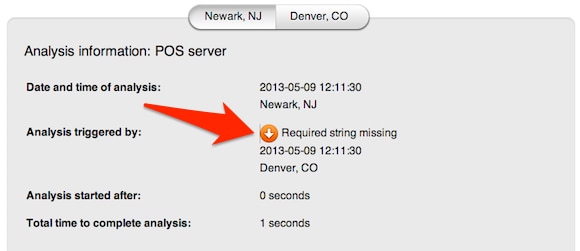
- In the upper half of the Root Cause Analysis you can find some basic information, including the reason for the outage.
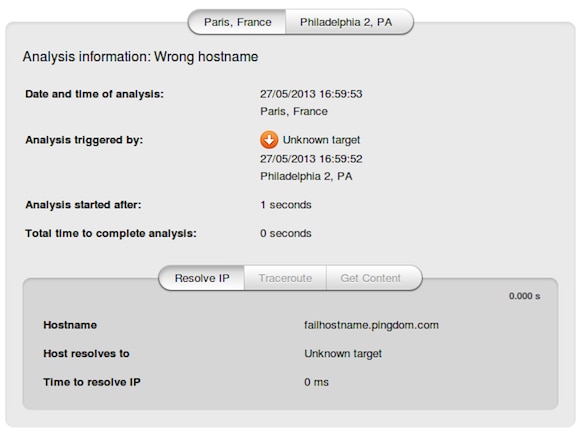
- Under the “Resolve IP,” “Traceroute,” and “Get Content” tabs, you can find more detailed information on the outage. We will go over these in more detail below.

How can the Root Cause Analysis help me investigate downtime?
The Root Cause Analysis will give you additional information about the downtime in three areas: resolve IP, traceroute, and get content.
Resolve IP
Here you can find out if there were a problem with DNS resolution at the time of the alert. This information can help you determine if the name servers were unavailable or whether the check simply tried to use the wrong IP. It’s possible that your web host experienced some issues so they should be your first port of call.
Traceroute
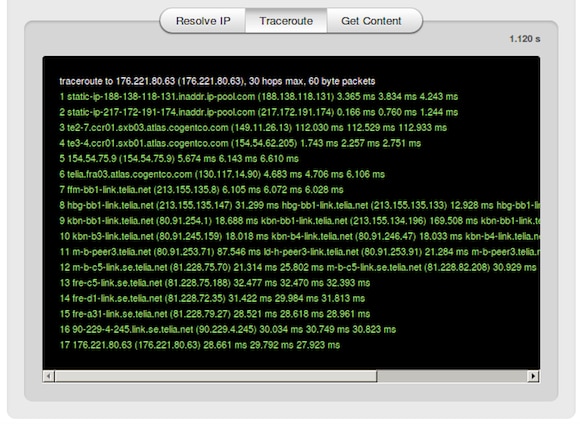
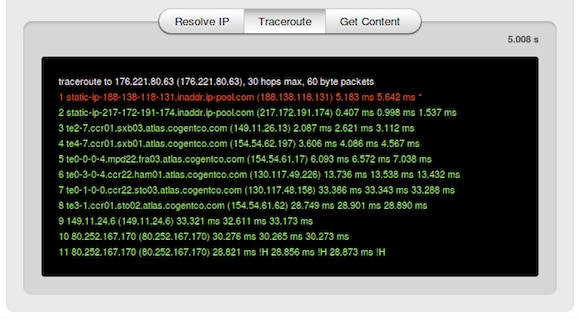
A traceroute is provided, which may be helpful when troubleshooting connectivity issues. It basically shows you the route the connection takes from Pingdom’s infrastructure to your server. By comparing a successful traceroute with the one found in this section of the Root Cause Analysis, you can get an idea of where the problem lies. Very often a problem identified by a traceroute is a global problem, meaning you will most likely not be able to do anything about the problem yourself.
However, the closer to your web host the traceroute breaks , the more likely it is a problem on your web host’s end, and not necessarily a more widespread problem affecting the Internet.
Here is a working traceroute:
And a traceroute that did not get through:
If this looks like mumbo-jumbo to you, don’t worry, we are looking at publishing further troubleshooting articles in the future, including one or more on traceroute.
Get Content
If a connection is established and data exchanged with the web server (for an HTTP check) the response and requests can be found in the Get Content section. This information can help you troubleshoot server side problems, in particular. This could include:
-
Missing pages (HTTP 404 Page not found): If this occurs, double-check the URL specified for the check.
-
Unavailable backend or load balancing servers (HTTP 503 Service unavailable): This would indicate problems with your web server.
-
Unauthorized access (HTTP 401 Unauthorized or HTTP 403 Forbidden): Double-check so the correct authentication information has been specified for the check.
Troubleshooting starts here
We hope that you now agree with us that looking at the Root Cause Analysis when a downtime is reported for your website is a good way to start identifying what went wrong. In some cases it may point to general problems on the Internet, in other cases there may be something wrong with the configuration of your server.
Have you used the Root Cause Analysis to investigate a downtime of your server? If so, post about it in the comments below, we’d love to hear about your experience.


