Synthetic Monitoring

Simulate visitor interaction with your site to monitor the end user experience.

View Product Info

FEATURES

Simulate visitor interaction

Identify bottlenecks and speed up your website.

Learn More

Real User Monitoring

Enhance your site performance with data from actual site visitors

View Product Info

FEATURES

Real user insights in real time

Know how your site or web app is performing with real user insights

Learn More

Infrastructure Monitoring Powered by SolarWinds AppOptics

Instant visibility into servers, virtual hosts, and containerized environments

View Infrastructure Monitoring Info
Comprehensive set of turnkey infrastructure integrations

Including dozens of AWS and Azure services, container orchestrations like Docker and Kubernetes, and more 

Learn More

Application Performance Monitoring Powered by SolarWinds AppOptics

Comprehensive, full-stack visibility, and troubleshooting

View Application Performance Monitoring Info
Complete visibility into application issues

Pinpoint the root cause down to a poor-performing line of code

Learn More

Log Management and Analytics Powered by SolarWinds Loggly

Integrated, cost-effective, hosted, and scalable full-stack, multi-source log management

 View Log Management and Analytics Info
Collect, search, and analyze log data

Quickly jump into the relevant logs to accelerate troubleshooting

Learn More

Facebook makes it official: We hate Mondays

Facebook has released a “happiness index” based on the status updates people make on their site. They have an algorithm that looks for words connected with positive and negative feelings, and categorize the status updates accordingly.
The GNH as it’s called, the Gross National Happiness index, currently only looks at status updates from US Facebook users, which makes sense since it’s a language-based study tool. (Hopefully Facebook will soon add similar indices for other countries as well.)
When you study the graphs that Facebook generates, a weekly pattern quickly becomes obvious. Unsurprisingly we’re at our happiest during public holidays and on Fridays and weekends, but a closer look at the graphs reveals what we’ve suspected for a long time:
People hate Mondays with a vengeance. (Garfield was right!)
Just look at these graphs.

Happiness level:
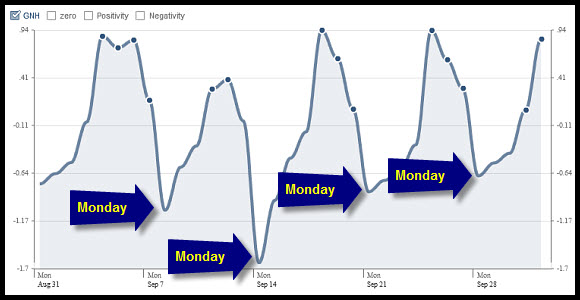

As you can see, the overall level of happiness bottoms out every Monday.
The low level of happiness on Mondays isn’t just caused by a lack of positivity. If we look at the negativity alone, it becomes clear that people are in a really negative mood on Mondays.

Negativity level:
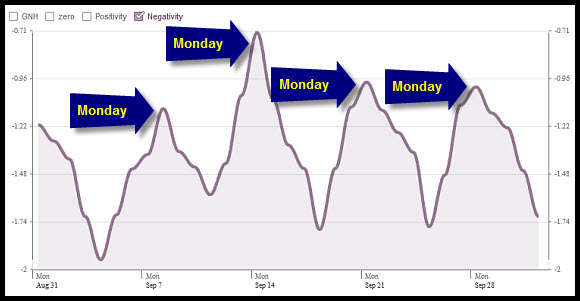

People really do pick themselves up during the weekends, though, and we’re a lot happier on Fridays as well (anticipating the weekend, we presume?).

Positivity level:
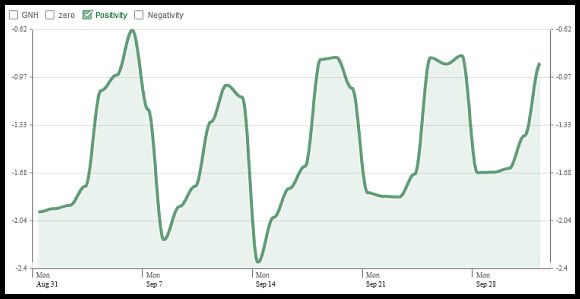

We bet you can guess on which weekdays those drops in positivity take place… 😉
This “happiness index” clearly shows Facebook’s data mining potential. Considering its huge user base and active users, there are tons upon tons of data available, and the question is how Facebook will be using it. We’d love to see more of these “indices”. As long as the data is of a general nature there shouldn’t be any privacy concerns, so we’re all for this kind of information being made available.
Additional information about the GNH index can be found over at the Facebook blog. (Check it out, it’s an interesting read.)
Data source: All graphs are from Facebook’s United States Gross National Happiness page, with those elegant arrows added by us.
Introduction to Observability

These days, systems and applications evolve at a rapid pace. This makes analyzi [...]

Webpages Are Getting Larger Every Year, and Here’s Why it Matters

Last updated: February 29, 2024 Average size of a webpage matters because it [...]

A Beginner’s Guide to Using CDNs

Last updated: February 28, 2024 Websites have become larger and more complex [...]

The Five Most Common HTTP Errors According to Google

Last updated: February 28, 2024 Sometimes when you try to visit a web page, [...]

Page Load Time vs. Response Time – What Is the Difference?

Last updated: February 28, 2024 Page load time and response time are key met [...]

Monitor your website’s uptime and performance

With Pingdom's website monitoring you are always the first to know when your site is in trouble, and as a result you are making the Internet faster and more reliable. Nice, huh?

START YOUR FREE 30-DAY TRIAL

MONITOR YOUR WEB APPLICATION PERFORMANCE

Gain availability and performance insights with Pingdom – a comprehensive web application performance and digital experience monitoring tool.

START YOUR FREE 30-DAY TRIAL
Start monitoring for free