 Do you live in a country that loves Apple’s iPad? Most of us probably think we do, but we wanted to be able to tell you for sure. So even though we have written about the iPad many times before, it’s now time for us to tackle this hotly contested topic again.
Read on to find out, which countries are the most iPad-friendly.
Perhaps you live in one of them.
The most iPad-friendly countries
To answer the question of which countries are the most iPad-friendly, we used web-browsing data from StatCounter, which is based on visitor stats from more than three million sites (see further details at the end of the article). StatCounter includes the iPad in its operating system stats, so we get a good indication of the iPad’s popularity.
What we found was that the top 10 iPad-friendly countries are: Singapore, Brunei, Angola, Nigeria, Australia, Kuwait, United Kingdom, Netherlands, Bahamas, and Hong Kong.
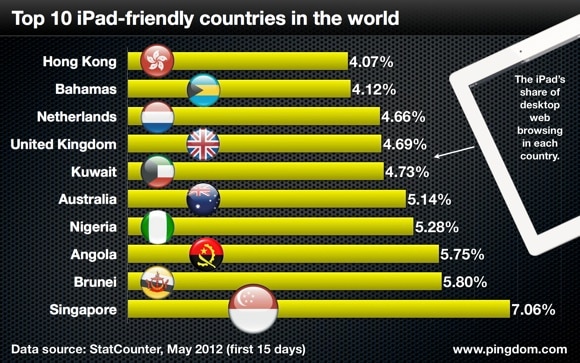
As you can see, Singapore is in the lead, with just over 7% of desktop web browsing traffic in the country. Brunei and Angola follow close behind with just under 6%. Clearly, in these countries, as in many others, the iPad is having quite an impact.
The most iPad-friendly regions
That was the top 10 countries in the world, which are iPad-friendly in the sense that the population there browse the web a lot with Apple’s tablet. But what does it look like if we apply this to a map of the entire world?
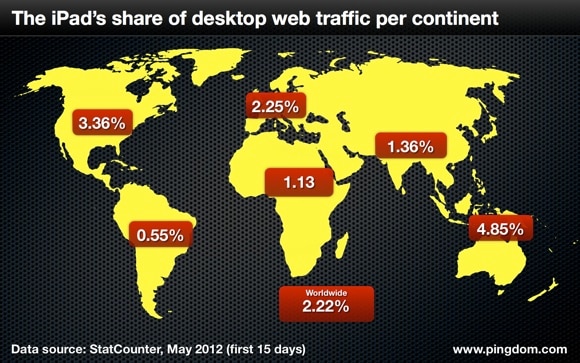
Then we see Oceania in a clear lead when it comes to iPad usage, closely followed by North America, Europe, and then Asia. Worldwide, the iPad accounted for 2.22% of all desktop web traffic.
Interestingly enough, although no countries in North America make it onto the top 10 list, as a region it scores a rather respectable 3.36%.
And in case you were curious, Android tablets accounted for 0.33% of worldwide desktop browsing.
What mark will the new iPad leave?
There you have it, how iPad-friendly countries around the world are. This doesn’t say anything about how popular the new iPad is though, something that would be interesting to know.
Granted, it’s now only a couple of months since Apple released its third-generation iPad, but it may cause bloat on the web.
If you have an iPad, do you find that you use it a lot to browse the web?
About the data: We looked at desktop OS market share data from StatCounter, which is based on visitor stats from more than three million websites. StatCounter reports iPad web traffic as “iOS” in the operating system category. To get up-to-date numbers, we focused on the month of May, 2012. You can see all our data here.
Flags of Angola, Australia, and Nigeria, as well as flags of countries in Asia and Europe, and top picture via Shutterstock.
