Even today, in 2012, some people don’t have broadband Internet connections, relying instead on phone lines and those good old dial-up modems. By today’s standards, those connections are extremely slow. Not only is the transfer speed slow, the latency is worse too.
On top of that, today’s websites are generally not designed for such slow connections. Surfing the web on a dial-up modem today is character building. That’s what you say about excruciating, painful experiences, right?
We wanted to see just how bad the situation is today. How long do regular web pages take to load over dial-up?
Slow, slower, slowest…
For this survey, we tested the top 50 sites in the United States with our Full Page Test in Pingdom Tools. That let us find out exactly how big these websites are, which helped us estimate how long they would take to load over a 56 kbit/s dial-up connection.
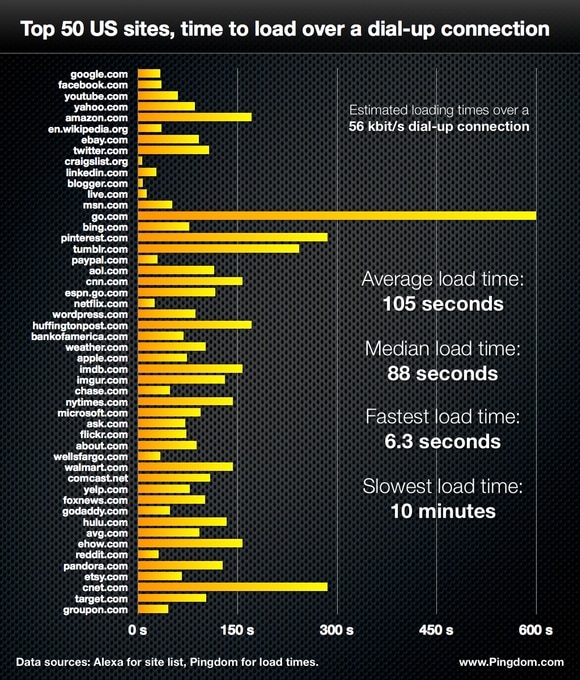
Did you think it would be this bad? For example, loading the front page of the English version of Wikipedia would take in excess of 30 seconds. And that page isn’t in any way big by today’s standards, weighing in under 250 kilobytes.
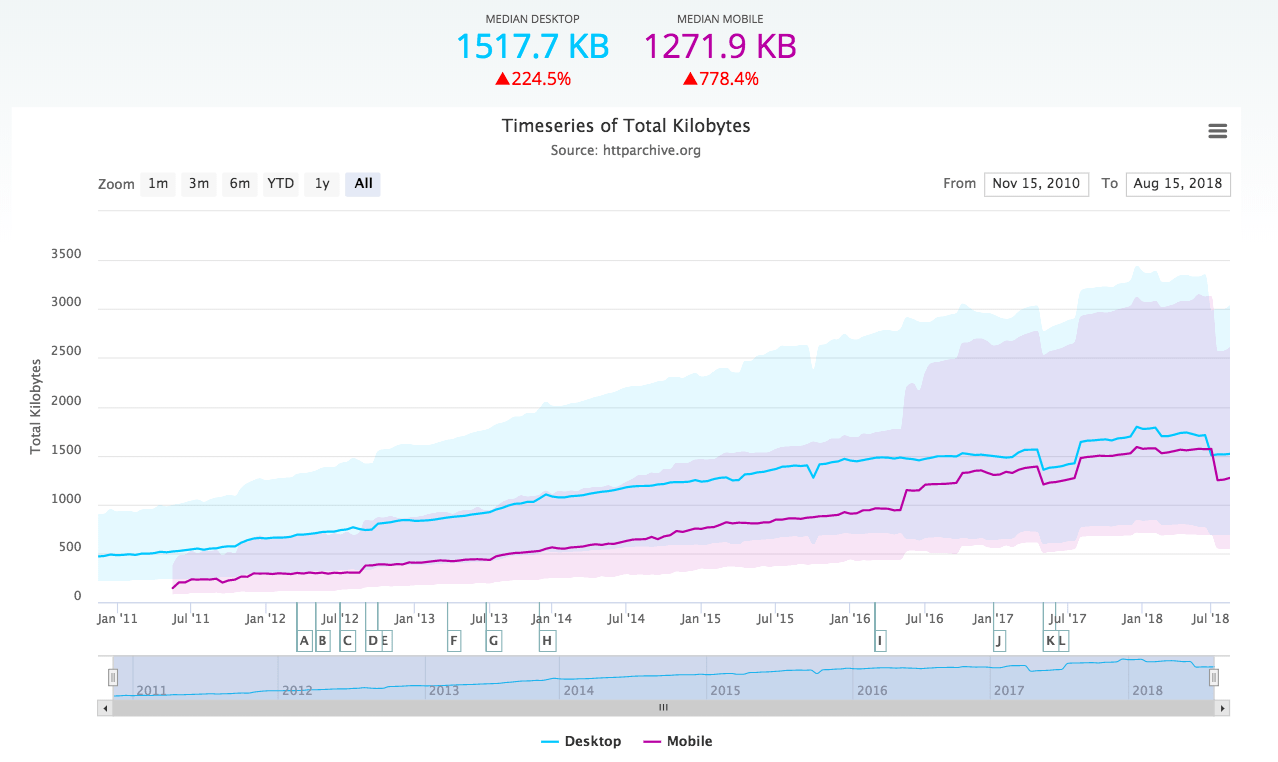
According to the HTTP Archive, as of this June the average web page size is just over a megabyte. That takes more than 2 minutes and 30 seconds to load over dial-up.
Even a minimal site like Google.com takes in excess of 10 seconds to load. Today’s sites simply are not adapted to slow Internet connections, and the resulting loading times can often be quite extreme.
Some standouts:
- Go.com: 10 minutes (half of which is to load videos)
- Pinterest.com: 4 minutes, 46 seconds
- Cnet.com: 4 minutes, 46 seconds
- Tumblr.com: 4 minutes, 3 seconds
- Amazon.com: 2 minutes, 51 seconds
- CNN.com: 2 minutes, 37 seconds
- IMDB.com: 2 minutes: 37 seconds
- Walmart.com: 2 minutes, 23 seconds
So which of these 50 sites is the fastest? The minimalistic Craigslist.org. At a mere 44.7 kilobytes, it should take around 6 seconds to load on a 56 kbit/s connection.
What makes it so slow?
It’s mostly a matter of download size. The number of requests it takes to load a web page matters (because each has overhead), but on these slow connections, the actual transfer size quickly becomes a major factor.
For example, Go.com has 2 megabytes of video content, which makes up half the size of the page. On many other sites, images make up most of what is loaded. The web is a lot prettier today, but that comes at a cost.
To give you an idea of how much size affects load time on slow connections, 100 kilobytes of data takes more than 14 seconds to download on a 56 kbit/s connection.
Conclusion
The important thing here isn’t really the individual load times of these sites, but to point out this larger phenomenon: web design today gives none or very little consideration to people with poor internet connections.
Part of this discussion is a bit tongue in cheek, but we’re not solely joking around with this post. There’s a reality to consider here. Do we care about dial-up users?
Around 3% of US Internet users are currently on dial-up. Internationally, that number is often much higher. That’s a significant chunk of Internet users who you ignore at your own risk.
We’re not saying this is necessarily bad. It’s just the state of affairs, and maybe the price of progress. However, we wanted to shine a spotlight on this because many of us simply don’t think about it anymore. We’re so used to our fast Internet connections that we often forget that not everyone has them.
Broadband users get frustrated when they have to wait a few seconds for a page to load. Imagine what your experience would be on dial-up.
Detailed test results (for you data enthusiasts)
For those of you who want to dig into the data a bit more, and perhaps explore why these pages are so large (or small), we’ve added this list which also includes links to saved tests in Pingdom Tools. Tip: In Pingdom Tools, the Page Analysis tab will show you a handy breakdown of what is loaded.
| Site | Page size (kB) | Details | Over 56 kbit/s modem (s) | Over basic 3G (384 kbit/s) (s) |
|---|---|---|---|---|
| google.com | 234.1 | Saved test | 33 | 4.9 |
| facebook.com | 248.4 | Saved test | 35 | 5.2 |
| youtube.com | 419.6 | Saved test | 60 | 8.7 |
| yahoo.com | 601.8 | Saved test | 86 | 12.5 |
| amazon.com | 1200 | Saved test | 171 | 25.0 |
| en.wikipedia.org | 247.7 | Saved test | 35 | 5.2 |
| ebay.com | 641.2 | Saved test | 92 | 13.4 |
| twitter.com | 749 | Saved test | 107 | 15.6 |
| craigslist.org | 44.7 | Saved test | 6 | 0.9 |
| linkedin.com | 193.9 | Saved test | 28 | 4.0 |
| blogger.com | 52.8 | Saved test | 8 | 1.1 |
| live.com | 90.9 | Saved test | 13 | 1.9 |
| msn.com | 362.5 | Saved test | 52 | 7.6 |
| go.com | 4200 | Saved test | 600 | 87.5 |
| bing.com | 538.8 | Saved test | 77 | 11.2 |
| pinterest.com | 2000 | Saved test | 286 | 41.7 |
| tumblr.com | 1700 | Saved test | 243 | 35.4 |
| paypal.com | 206.4 | Saved test | 29 | 4.3 |
| aol.com | 805 | Saved test | 115 | 16.8 |
| cnn.com | 1100 | Saved test | 157 | 22.9 |
| espn.go.com | 815.4 | Saved test | 116 | 17.0 |
| netflix.com | 173.5 | Saved test | 25 | 3.6 |
| wordpress.com | 608.5 | Saved test | 87 | 12.7 |
| huffingtonpost.com | 1200 | Saved test | 171 | 25.0 |
| bankofamerica.com | 479.1 | Saved test | 68 | 10.0 |
| weather.com | 713.1 | Saved test | 102 | 14.9 |
| apple.com | 517.5 | Saved test | 74 | 10.8 |
| imdb.com | 1100 | Saved test | 157 | 22.9 |
| imgur.com | 918.3 | Saved test | 131 | 19.1 |
| chase.com | 334.9 | Saved test | 48 | 7.0 |
| nytimes.com | 1000 | Saved test | 143 | 20.8 |
| microsoft.com | 661.3 | Saved test | 94 | 13.8 |
| ask.com | 500.2 | Saved test | 71 | 10.4 |
| flickr.com | 512.9 | Saved test | 73 | 10.7 |
| about.com | 619 | Saved test | 88 | 12.9 |
| wellsfargo.com | 235.6 | Saved test | 34 | 4.9 |
| walmart.com | 1000 | Saved test | 143 | 20.8 |
| comcast.net | 763.6 | Saved test | 109 | 15.9 |
| yelp.com | 546 | Saved test | 78 | 11.4 |
| foxnews.com | 708.8 | Saved test | 101 | 14.8 |
| godaddy.com | 334.7 | Saved test | 48 | 7.0 |
| hulu.com | 937 | Saved test | 134 | 19.5 |
| avg.com | 646.8 | Saved test | 92 | 13.5 |
| ehow.com | 1100 | Saved test | 157 | 22.9 |
| reddit.com | 218.9 | Saved test | 31 | 4.6 |
| pandora.com | 893.9 | Saved test | 128 | 18.6 |
| etsy.com | 462.7 | Saved test | 66 | 9.6 |
| cnet.com | 2000 | Saved test | 286 | 41.7 |
| target.com | 718.4 | Saved test | 103 | 15.0 |
| groupon.com | 316.8 | Saved test | 45 | 6.6 |
This list is slightly sanitized. We removed a couple of, shall we say, NSFW sites. Also, we only tested the home page of these sites. For some sites that is just a simple login page. The actual page after the login will in many cases be bigger.
Some ISPs compress content to dial-up users so their experience is sometimes slightly less frustrating than what you see here. On the other hand, we haven’t included the extra time multiple requests usually take, plus the fact that phone line noise often lowers the effective transfer rate to around 40-50 kbit/s.
We’ve measured how large the websites are when you first visit them, i.e. loading everything on the page. The second time, some of the content will usually be cached, something that is hugely important on these slower connections.
Image credit: Top image via Shutterstock.
And here is a higher-resolution version of the chart, if you want one.
