 Top500.org recently released updated statistics about the fastest supercomputers in the world. They do this twice per year, and every time the reports make computing enthusiasts drool with mind-boggling performance numbers. You think your souped-up server or gaming rig is fast? Think again.
We cherry-picked some of the more interesting numbers, and made a few additional calculations for your reading pleasure. Enjoy.
- 548,352 – the number of CPU cores in the K Computer in Japan, the world’s currently fastest supercomputer. It’s the result of having 68,544 SPARC64 VIIIfx CPUs with eight cores each.
- 1,820,352 – the combined number of CPU cores in the top 10 supercomputers
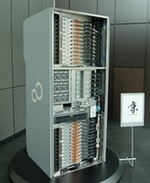
- 672 – The number of computer racks that make up the K Computer (one is seen on the image for this post).
- 8.2 petaflops – The computing performance of the K Computer. It’s more powerful than the five next systems (i.e. position 2-6) combined.
- 8,200,000,000,000,000 – 8.2 petaflops written out as floating point operations per second (8.2 quadrillion instructions per second).
- 2.6 petaflops – The computing performance of the second-fastest supercomputer, the Tianhe-1A in China.
- 20.3 petaflops – The combined computing performance of the top 10 supercomputers.
- 1.04 petaflops – The computing performance of the “slowest” of the top 10.
- 9.9 megawatt – The power consumption of the K Computer.
- $10 million – The yearly power costs for the K Computer.
- 42.8 megawatt – The combined power consumption of the top 10 supercomputers.
- 40,000 – The number of homes that amount of electricity could power.
- 5 – Number of US supercomputers in the top 10. Japan has 2, China has 2, and France has 1.
A cool aside regarding the K Computer is that it isn’t even fully constructed yet, and it’s already outperforming everything out there by a huge margin. Its computing power is roughly the equivalent of a million linked desktop computers. Quite a comeback for Japan. This is the first time they’ve held the number one spot since 2004, when the Earth Simulator ruled the pack.
