Synthetic Monitoring

Simulate visitor interaction with your site to monitor the end user experience.

View Product Info

FEATURES

Simulate visitor interaction

Identify bottlenecks and speed up your website.

Learn More

Real User Monitoring

Enhance your site performance with data from actual site visitors

View Product Info

FEATURES

Real user insights in real time

Know how your site or web app is performing with real user insights

Learn More

Infrastructure Monitoring Powered by SolarWinds AppOptics

Instant visibility into servers, virtual hosts, and containerized environments

View Infrastructure Monitoring Info
Comprehensive set of turnkey infrastructure integrations

Including dozens of AWS and Azure services, container orchestrations like Docker and Kubernetes, and more 

Learn More

Application Performance Monitoring Powered by SolarWinds AppOptics

Comprehensive, full-stack visibility, and troubleshooting

View Application Performance Monitoring Info
Complete visibility into application issues

Pinpoint the root cause down to a poor-performing line of code

Learn More

Log Management and Analytics Powered by SolarWinds Loggly

Integrated, cost-effective, hosted, and scalable full-stack, multi-source log management

 View Log Management and Analytics Info
Collect, search, and analyze log data

Quickly jump into the relevant logs to accelerate troubleshooting

Learn More

Displaying Pingdom website monitoring data on a Klipfolio dashboard

By monitoring your websites and servers with Pingdom, you can be the first to know if something is not working. That way, you can fix whatever is wrong before anyone else notices.

Getting an alert via email, SMS, Twitter or mobile app if something does go wrong is of course very helpful. But displaying the status of your website on a dashboard can sometimes be a great complement.

If you’re running some sort of dashboard, whether it’s on the wall in your office or on your computer, perhaps you are using Klipfolio. It works across different devices and with a long line of data sources, including databases, files, any web service that offers an API, and many more.

Using Pingdom as a data source

The guys over at Klipfolio have just posted an article on how you can use Pingdom as the data source for a Klipfolio dashboard. Now you can in a simple way display your website monitoring and performance data from Pingdom on your Klipfolio dashboard.

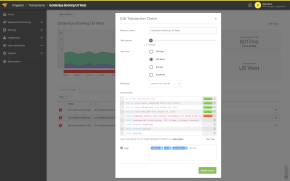
You find all the necessary details in the article, but there are really only three simple steps to set this up:

  1. Start the data source creation process.
  2. Specify the URL and query parameters.
  3. Authenticate with Pingdom.

How to get a Pingdom API key

One thing we’d like to add is that to get this working you need a Pingdom account as well as a Pingdom API key.

If you don’t already have a Pingdom account you can grab one here.

You get the API key by logging in to your account at my.pingdom.com, then select “The Pingdom API” in the menu “Account.” Click “Register an application,” fill in the information and you will be provided with a new API key for your Klipfolio dashboard.

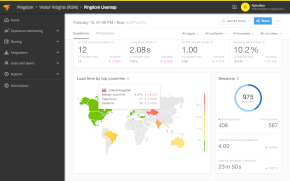
Once you have created the data source for Pingdom you can go ahead and create new “klips” for your dashboard.

In case you want to have a look, the complete documentation for the Pingdom API is available API.

Have you built a cool dashboard?

That’s how easy it is to use website monitoring and performance data from your Pingdom checks on a Klipfolio dashboard. We know you want to try that right away.

Have you built a cool dashboard with Pingdom monitoring data, perhaps displaying it in your office? Let us know, we’d love to hear from you.

Image (top) via Shutterstock.

Introduction to Observability

These days, systems and applications evolve at a rapid pace. This makes analyzi [...]

Webpages Are Getting Larger Every Year, and Here’s Why it Matters

Last updated: February 29, 2024 Average size of a webpage matters because it [...]

A Beginner’s Guide to Using CDNs

Last updated: February 28, 2024 Websites have become larger and more complex [...]

The Five Most Common HTTP Errors According to Google

Last updated: February 28, 2024 Sometimes when you try to visit a web page, [...]

Page Load Time vs. Response Time – What Is the Difference?

Last updated: February 28, 2024 Page load time and response time are key met [...]

Monitor your website’s uptime and performance

With Pingdom's website monitoring you are always the first to know when your site is in trouble, and as a result you are making the Internet faster and more reliable. Nice, huh?

START YOUR FREE 30-DAY TRIAL

MONITOR YOUR WEB APPLICATION PERFORMANCE

Gain availability and performance insights with Pingdom – a comprehensive web application performance and digital experience monitoring tool.

START YOUR FREE 30-DAY TRIAL
Start monitoring for free