
 Have you ever asked yourself, “what if?”
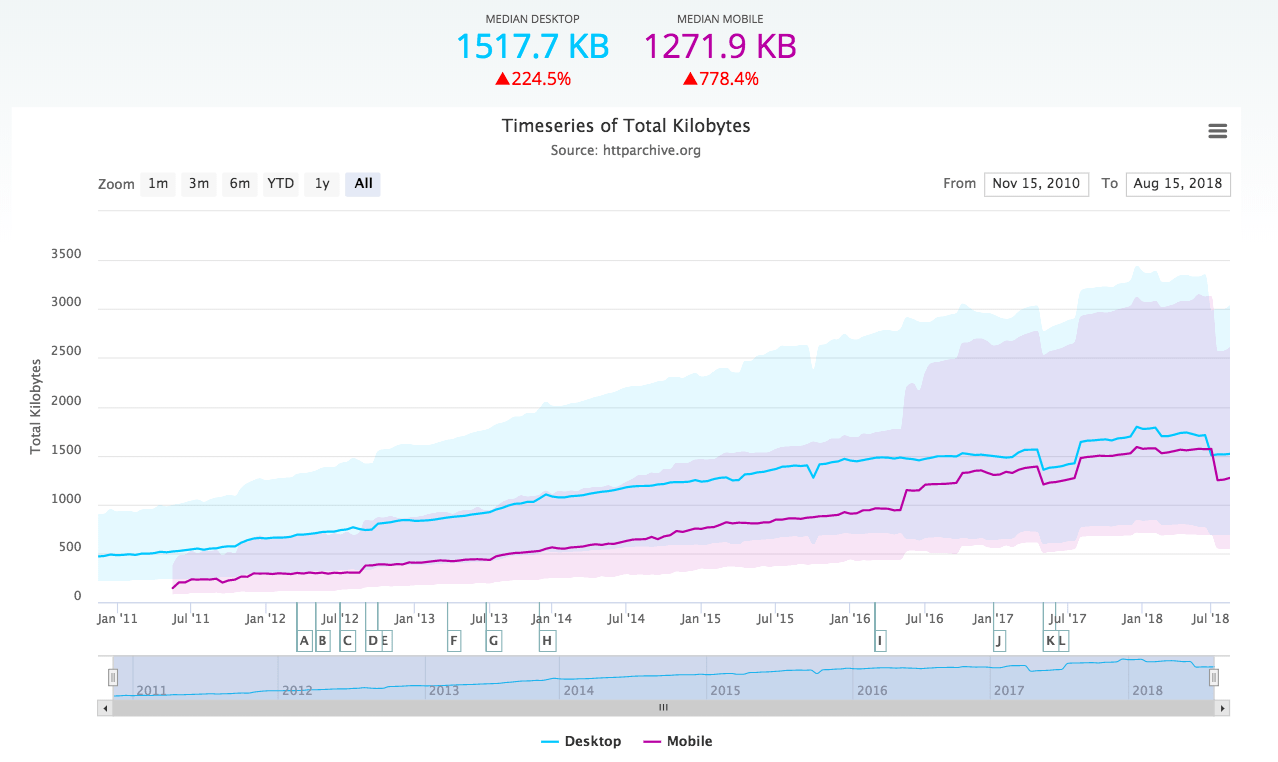
Today, the global distribution of Internet users doesn’t really reflect how the population is distributed in the real world. Many countries (and whole regions) are either over- or underrepresented. Internet penetration varies wildly between countries.
So let’s do a thought experiment. What would the Internet look like if all countries were on an equal footing in terms of Internet penetration? We’ll take the United States as a baseline, with 78% of its population being Internet users, a level many industrialized countries either match or exceed.
Worldwide changes
If all countries had the same Internet penetration as the United States, this is what the Internet would look like:

A few observations:
- The Internet as a whole would have 2.6x as many users as today.
- Asia would have 3.3x as many Internet users as today.
- Europe would have 1.3x as many Internet users as today.
- North America would pretty much be unchanged.
- Latin America would have 2.2x as many Internet users as today.
- The Middle East would have 2.4x as many Internet users as today.
- Oceania/Australia would have 1.3x as many Internet users as today.
- Africa would have 6.8x as many Internet users as today and would rise to become the second-largest region in the world after Asia.
That last bullet point brings up something interesting…
Power shifts
The hypothetical change we discussed would drastically shift the balance of the entire Internet.
- Asia would go from representing 44% of the Internet to 56%.
- Africa would go from 5.7% to 15%.
- Europe would go from 22.7% to 11.8%.
- Latin America would go from 10.3% to 8.6%.
- North America would go from 13% to 5%.
- The Middle East would go from 3.3% to 3.1%.
- Oceania/Australia would go from 1% to 0.5%.
The new top 10 countries
The change of balance in our hypothetical Internet would of course also change which countries constitute the top countries on the Internet.
What would happen is that countries with large populations but underdeveloped Internet presences would show up. Our hypothetical top 10 would be made up of the 10 most populous countries in the world, since all countries would have the same 78% Internet penetration as the United States.
| # | Real Internet | Hypothetical Internet | Size boost |
|---|---|---|---|
| 1 | China (485 million) | China (1.046 billion) | 2.2x |
| 2 | United States (245 million) | India (931 million) | 9.3x |
| 3 | India (100 million) | United States (245 million) | 1.0x |
| 4 | Japan (99 million) | Indonesia (192 million) | 4.9x |
| 5 | Brazil (76 million) | Brazil (159 million) | 2.1x |
| 6 | Germany (65 million) | Pakistan (147 million) | 7.2x |
| 7 | Russia (60 million) | Bangladesh (124 million) | 71.6x |
| 8 | United Kingdom (51 million) | Nigeria (122 million) | 2.8x |
| 9 | France (45 million) | Russia (109 million) | 1.8x |
| 10 | Nigeria (44 million) | Japan (99 million) | 1.0x |
Note that the “size boost” column refers to how much bigger the countries in the hypothetical top 10 would be.
Aside from the shuffling around, some countries in the top 10 would be new arrivals, and some would be pushed out of the top 10 altogether.
- New in the top 10: Indonesia, Pakistan, Bangladesh.
- Pushed out of the top 10: Germany, United Kingdom, France.
- Size perspective: The top three countries in our hypothetical Internet would have more Internet users together than the entire Internet has today.
Is this a possible future?
This was a thought experiment in every sense of the word, based the single assumption that all countries would have the same Internet penetration.
Easier said than done, of course. This assumption comes with a full host of caveats, like the demands on technological development, education, infrastructure, general economy, etc. Countries where people are currently starving or living in abject poverty probably won’t make Internet access a high priority unless their living situation changes significantly for the better.
That said, the world is changing, and in many ways for the better (with some horrible exceptions, unfortunately).
Is this the future Internet we’re seeing?
It might not be too far from it, actually. We’ve shown you before how drastically the Internet changed between 2000 and 2010. Perhaps a similar retrospective in 2020 will show us something along the lines of this post.
This would hardly happen anytime soon, and such a drastic change as the one we have outlined here would probably take more than just a decade. However, it’s an interesting piece of information to keep in mind because it shows us how distorted the current Internet population is when compared to the real-world population.
Finally, since we used the United States as a baseline, how would it be affected by our hypothetical scenario? The change would be pretty dramatic. The United States would go from representing 11.7% of the Internet to 4.5%.
Data source: Current Internet user and population numbers from Internet World Stats.