 In December, we looked at how the Internet has spread across the world from 1991 to 2010. We presented this in the form of an animation, highlighting each country in different colors depending in what percentages of the population were online.
Now we bring you a follow-up. This time we use data from the World Bank for mobile subscriptions per 100 people and map it out over the years and the world.
As it turns out, there’s quite a difference between the two.
Mobile uptake comes later but happens much faster
You would probably expect the number of mobile subscriptions to start increasing later than the number of Internet users, and you would be correct. To make the comparison to the Internet penetration animation easier, we used the same time period, 1991 – 2010.
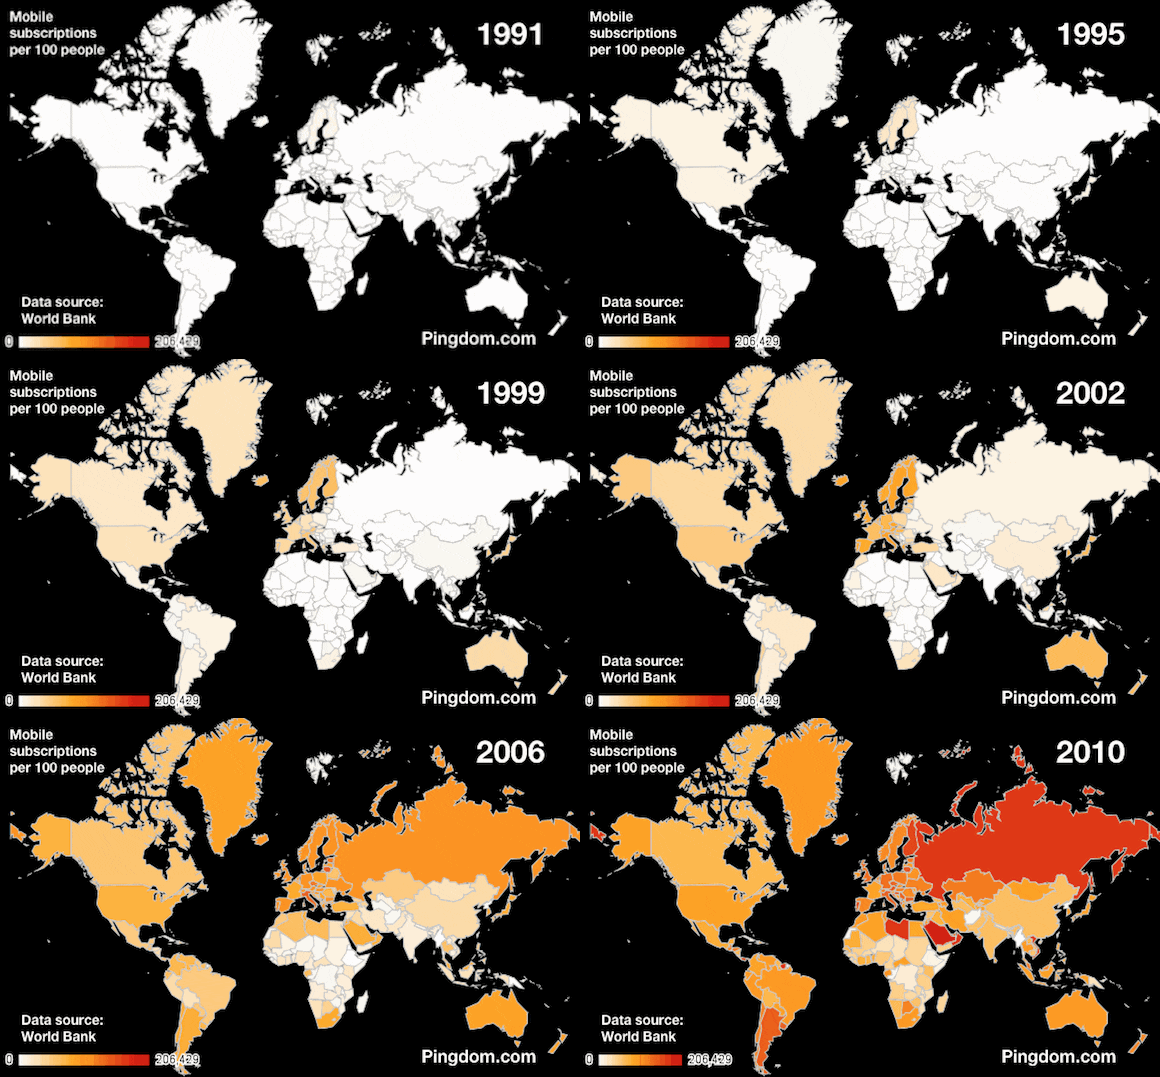
First a few comments on the animation below:
- The picture is an animated GIF. You may have to reload the page to see the animation again.
- In the animation, the redder a country is, the higher the number of mobile subscriptions per 100 people is.
- In the animation, white means there is no data from the World Bank or that there are no mobile subscriptions.
Here are a few numbers that further highlight the stunning growth in mobile subscriptions around the world:
- 102 – The number of countries that the World Bank show mobile subscription figures for in 1991.
- 227 – The number of countries that the World Bank show mobile subscription figures for in 2010.
- 0.4% – The average mobile penetration per country in the world in 1991.
- 91.1% – The average mobile penetration per country in the world in 2010.
- 6.59% – The mobile penetration in Sweden in 1991, the highest of any country for that year.
- 206.3% – The mobile penetration in Macao in 2010, the highest of any country for that year.
- 94 – The number of countries that in 2010 had more than 100% mobile penetration.
- 2002 – This year saw the first mobile penetration of over 100% and it was in Luxembourg.
- 171% – Mobile penetration in Libya in 2010.
- 167% – Mobile penetration in Russia in 2010.
- 188% – Mobile penetration in Saudi Arabia 2010.
- 90.2% – Mobile penetration in U.S. in 2010.
Still room for growth
There are mainly two things that strike us when watching this animation: how fast the mobile penetration has developed and how many countries see penetration over 100%, in some cases over 200%.
That there can be more mobile subscriptions than people in a country can easily be explained by individuals having more than one mobile phone, and that some subscriptions may be laying dormant when the user has abandoned them for whatever reason.
With an average mobile subscription rate of 91.1% worldwide in 2010, there’s plenty of room for growth. In markets that already have 200% penetration or more, there’s little room to grow in terms of the total number of handsets, but replacement cycles can be shortened to drive demand.
In any case, there doesn’t seem to be anything slowing mobile uptake down, that’s for sure.
