Synthetic Monitoring

Simulate visitor interaction with your site to monitor the end user experience.

View Product Info

FEATURES

Simulate visitor interaction

Identify bottlenecks and speed up your website.

Learn More

Real User Monitoring

Enhance your site performance with data from actual site visitors

View Product Info

FEATURES

Real user insights in real time

Know how your site or web app is performing with real user insights

Learn More

Infrastructure Monitoring Powered by SolarWinds AppOptics

Instant visibility into servers, virtual hosts, and containerized environments

View Infrastructure Monitoring Info
Comprehensive set of turnkey infrastructure integrations

Including dozens of AWS and Azure services, container orchestrations like Docker and Kubernetes, and more 

Learn More

Application Performance Monitoring Powered by SolarWinds AppOptics

Comprehensive, full-stack visibility, and troubleshooting

View Application Performance Monitoring Info
Complete visibility into application issues

Pinpoint the root cause down to a poor-performing line of code

Learn More

Log Management and Analytics Powered by SolarWinds Loggly

Integrated, cost-effective, hosted, and scalable full-stack, multi-source log management

 View Log Management and Analytics Info
Collect, search, and analyze log data

Quickly jump into the relevant logs to accelerate troubleshooting

Learn More

Report from Velocity day 1

Day one of the Velocity conference in Santa Clara is over and we’ve had a great day. From arriving this morning to finishing up the sessions in the afternoon, it was full speed ahead with web performance and ops.

We’ve rarely seen such a high concentration of web geeks in one place, and even though the wifi was shaky to say the least, we had a great time. Here’s a brief report from the first day of Velocity.

The first day of the Velocity conference

When arriving, registration was fast and smooth, which, after a long trip, was much appreciated.
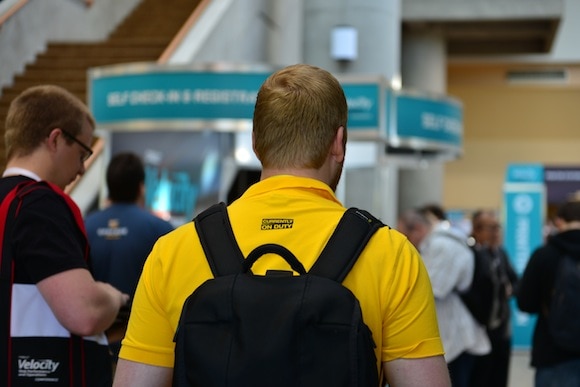
registering

Steve Souders kicked off Velocity 2013 with a brief welcome introduction.
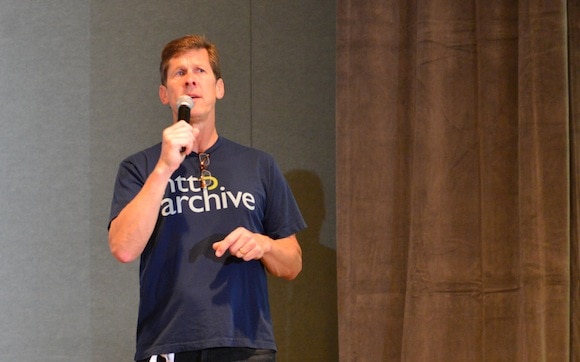
souders-welcoming

Mandi Walls of OpsCode talked about how to grow as a DevOps team. The goals for getting the team to grow, she said, are: transparency, reliability, resiliency, and correctness.
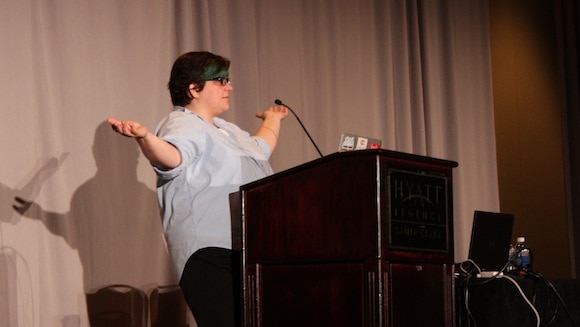
Mandi_Walls

Jay Edwards of PalominoDB gave a hands-on talk about Ansible. It’s an IT-automation tool, which is an easy to use alternative to Puppet and Chef.
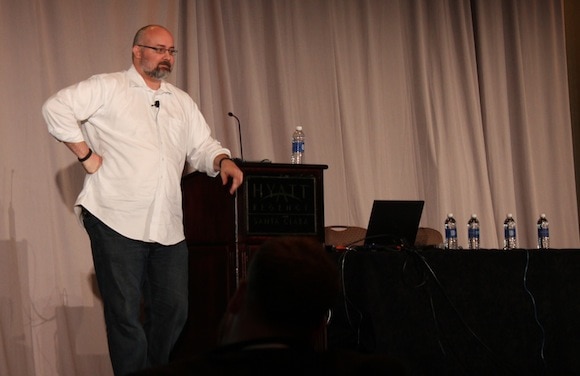
Jay_Edwards

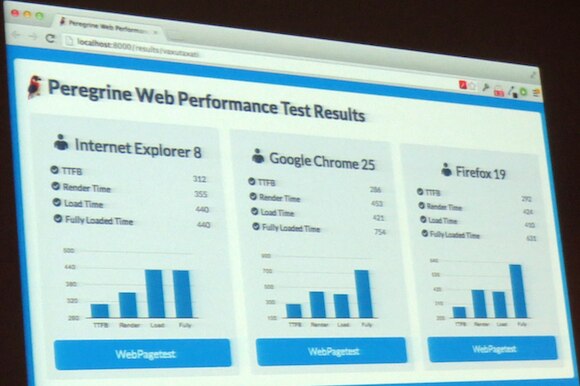
Marcel Duran of Twitter talked about how its internal tool Peregrine (named after one of the world’s fastest flying creatures) is used to benchmark updates before and after releases. The goal is to always improve speed, even when adding new features.
peregrine

Wifi was shaky throughout the day. Unfortunately, we saw the phrase “Trying to connect…” way too many times. The organizer’s  ops people definitely have a challenge on their hands for the rest of the conference.

wifi

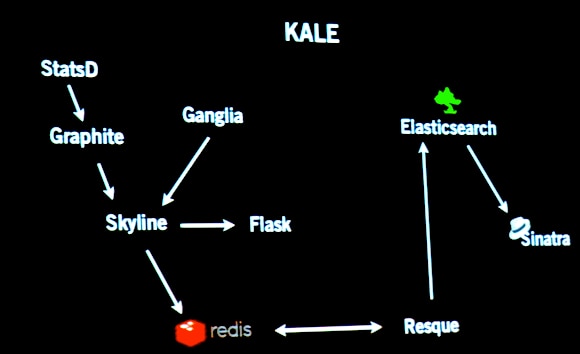
Abe Stanway and Jon Cowie of Etsy explained how they collect and analyze 250,000 metrics in nearly real-time.
etsy
Finally, we’d like to mention Guy Podjarny of Akamai who talked about images for the web. He covered a wide range of things like what images formats to use, how to deliver them, how and when to load them, and how to handle different devices. Did you know, for example, that you can save 72% of image weight by adapting them to smaller screens?

Looking forward to the rest of Velocity

We had a great first day at Velocity and we look forward to the rest of the week. Follow us on Twitter using the #velocityconf hashtag, and we’ll be back with another report tomorrow.

Introduction to Observability

These days, systems and applications evolve at a rapid pace. This makes analyzi [...]

Webpages Are Getting Larger Every Year, and Here’s Why it Matters

Last updated: February 29, 2024 Average size of a webpage matters because it [...]

A Beginner’s Guide to Using CDNs

Last updated: February 28, 2024 Websites have become larger and more complex [...]

The Five Most Common HTTP Errors According to Google

Last updated: February 28, 2024 Sometimes when you try to visit a web page, [...]

Page Load Time vs. Response Time – What Is the Difference?

Last updated: February 28, 2024 Page load time and response time are key met [...]

Monitor your website’s uptime and performance

With Pingdom's website monitoring you are always the first to know when your site is in trouble, and as a result you are making the Internet faster and more reliable. Nice, huh?

START YOUR FREE 30-DAY TRIAL

MONITOR YOUR WEB APPLICATION PERFORMANCE

Gain availability and performance insights with Pingdom – a comprehensive web application performance and digital experience monitoring tool.

START YOUR FREE 30-DAY TRIAL
Start monitoring for free