When it comes to taking care of our networking infrastructure here at Pingdom, the DevOps team works with a wide range of hardware and software tools.
With this article, we want to give you some suggestions for command line tools and utilities that are a common part of our toolbox. We have tried to make a varied selection so that there is hopefully something in here that you find useful in your daily admin work.
mtr
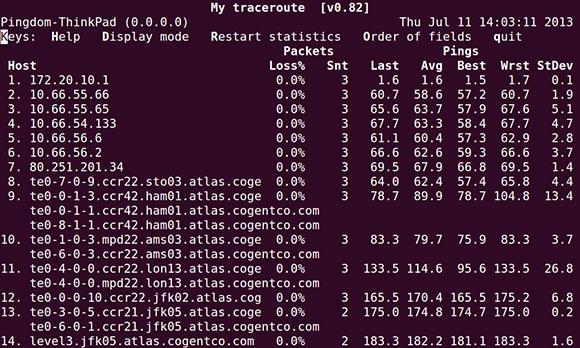
MTR (My traceroute), originally called Matt’s traceroute, is a combined ping and traceroute. It pings every hop to the target continuously to see on which hop(s) packet loss or latency exists.
Install in Ubuntu:
sudo apt-get install mtr-tiny
Test run:
mtr www.pingdom.com
pv
Pipe Viewer checks how many lines/characters per second that goes through a Linux pipe. For example, this can be used to see how many lines per second that goes through a log.
Install in Ubuntu:
sudo apt-get install pv
Test run:
sudo tail -f /var/log/apache/access.log |
grep "/testpage.html" | pv -lr >/dev/null
This will display how many times per second “/testpage.html” shows up in the access log. In other words, how many accesses that particular page gets per second in real-time.
nc
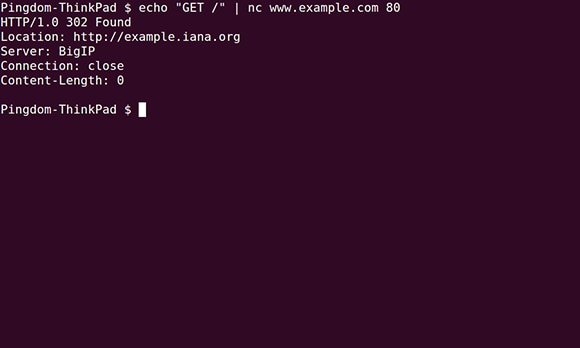
Netcat is a general toolbox for TCP and UDP connections. You can send data as well as listen to and serve up data with it. This is a utility with tremendous potential, which we’ve yet to fully explore.
Examples:
HTTP request:
echo "GET /" | nc www.example.com 80
Serve a web page on port 8080:
echo 'Hello, World!' | nc -l 8080
nmap
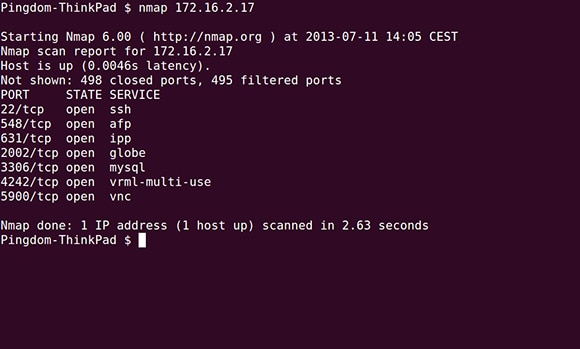
Nmap is a powerful and versatile security scanner. Although we rely on it for many things, we use it mainly as a port scanner, to see which ports that are open on a particular host. Please use nmap with discretion if you use it to scan computers and networks other than your own.
Install in Ubuntu:
sudo apt-get install nmap
Test run:
sudo nmap 192.168.0.150
du
Du (disk usage) shows disk usage of files and directories. It is a powerful way to hunt down what takes up space on a disk.
Test run:
sudo du -sh /home/* (shows usage of each users home directory)
lsof
The lsof (LiSt Open Files) command lists all open files and sockets. Lsof gives you information on which command each process is executing, and which user who opened it. It can also show you which port a daemon is listening on.
Test run:
sudo lsof -i TCP
In the example, lsof will show you information about all open TCP connections and listening sockets.
grc
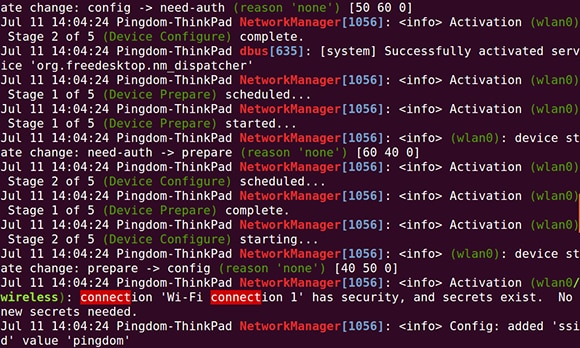
The General Colorizer tool puts color to any command-output to make it easier to read.
Install in Ubuntu:
sudo apt-get install grc
Test run:
sudo grc cat /var/log/syslog
mosh
Mosh (mobile shell) is a shell like SSH but built for being used on mobile connections. It uses UDP, predictions and various other techniques to make the shell more responsive on connections with high latency and packet loss. It also supports the client to change IP address during a session, and reconnect when contact is lost.
Install in Ubuntu (on both server and client):
sudo apt-get install mosh
Test run:
mosh <hostname>
This requires the mosh package on both server and client. Also, certain UDP ports must be opened if there is a restrictive firewall in between.
byobu
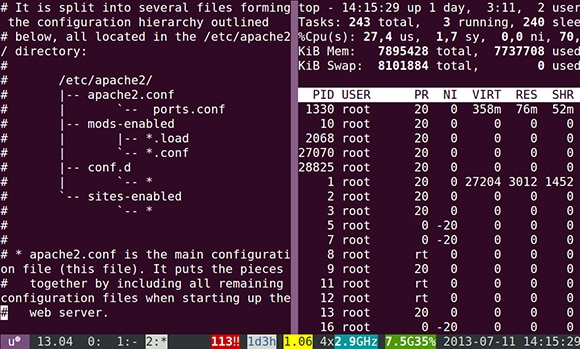
Byobu is a wrapper around GNU screen and tmux, which adds a window manager of sorts to the text-based shell. You can create new windows (tabs), cycle between them, split views, and much more.
Install in Ubuntu:
sudo apt-get install byobu
Test run:
SSH to a server with Byobu installed (or run it in the local shell) and then run Byobu. You can press F2 to create a new tab, alt-arrow to move between tabs, Ctrl/Shift-F2 to split a window, shift-arrow to move between splits, etc.
What else can you recommend to network administrators?
This is just a small sample of all the command line tools and utilities that we rely on in our everyday work to keep Pingdom running.
Do you have any especially useful command line tool you would like to share with us? Let us know in the comments below.
Image (Top) via Shutterstock.


