After a ton of research and requests from customers and developers alike, we’re very excited to announce the Pingdom Page Speed monitoring – a brand new product added to our monitoring suite.
Page Speed monitoring perfectly complements the different types of monitoring we already offer. The Page Speed monitoring will give you even better insights into the performance of your website.
The Page Speed check lets you perform a full page test, a lot like on our Pingdom Tools website, only fully automated. By introducing Page Speed monitoring, we continue the process of building the complete toolkit that will help developers and website owners make the web faster and more reliable.

Analyze and optimize website performance
Search engines like Google will penalize your search result rankings if your site is slow or produces a poor end-user-experience. And after all, everyone loves a fast website.
Our Page Speed test is here to help you analyze the load speed of your websites and learn how to make them faster. With the help of this check type you can identify what about a web page is fast, slow, too big, what best practices you’re not following, and so on.
When it comes to website performance, a few key questions are almost always more important than others: How fast does my website load? Developers want answer to: Did the changes I made have the right impact? But also, find out how I can improve my site’s performance. Historically you had to run these tests manually, like an animal, but now that feature is fully automated in My Pingdom.
Key features
Although there’s even more to it than what we’re presenting here, these are the most important features. If you’re familiar with the the Full Page Test on Pingdom Tools, you’ll notice that there are many similarities.
Examine all parts of a web page
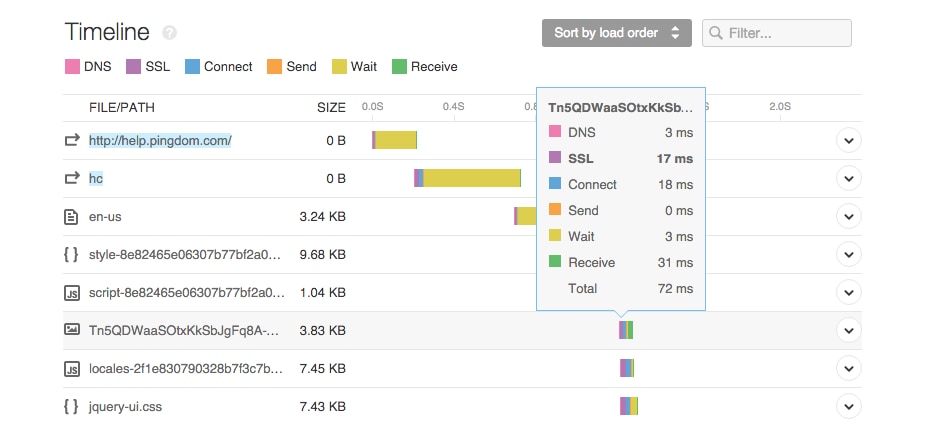
View file sizes, load times, and other details about every single object on a web page (HTML, JavaScript and CSS files, images, etc.). You can sort and filter this list in different ways to identify performance bottlenecks.
Analyze all HTTP requests in detail
View a full breakdown of the different stages of loading each object on a page, such as the time it took to perform the DNS lookup, connect to the web server, wait for a response, download the file, etc. You can even view the server’s response header for each request if you like. This is all very useful for identifying general performance issues, for example slow responses from a web server.

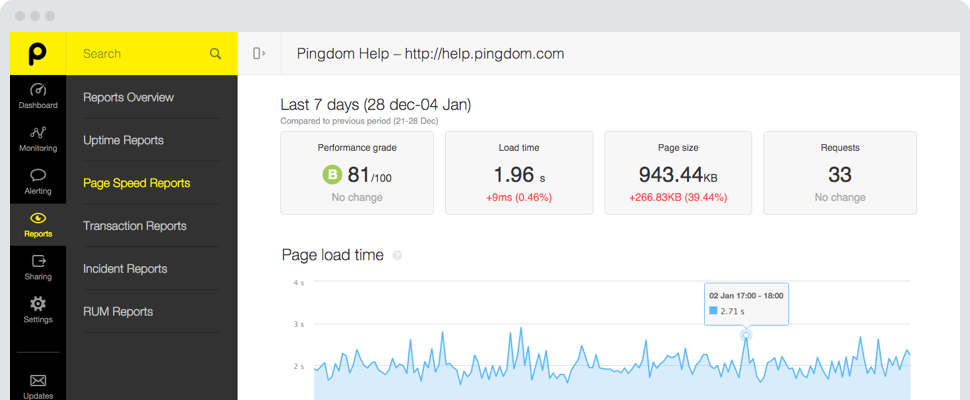
Performance overview and stats
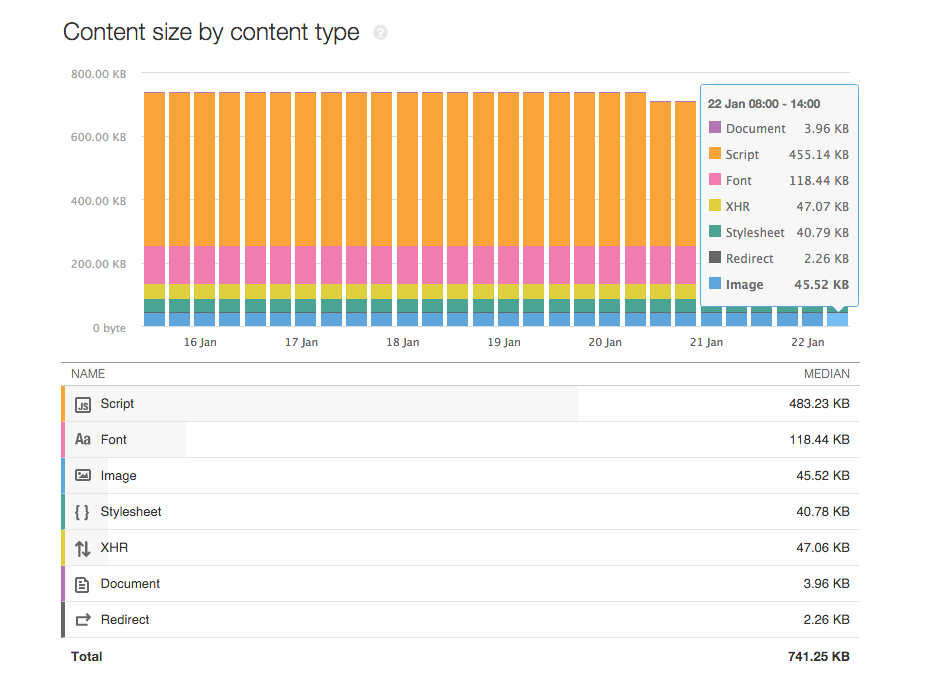
We automatically put together plenty of performance-related statistics for you based on the test result. It’s a quick way for you to pinpoint what slows your site down.

Track your performance history
All tests are saved so you can review it later and also see how things change over time (with pretty charts!). This is particularly helpful when you want to make sure the changes you have made had the intended effect.
Behind the scenes
All tests are done with an actual web browser – Google Chrome – so they will match the end-user experience exactly. So, what you see in the test results exactly matches what a web browser loads when it accesses the page you’re testing.
Introducing Advanced Checks
The Page Speed check is considered an “Advanced Check”. You will get a pool of advanced checks, where you can choose to add either Page Speed or Transaction monitoring checks. The number of Advanced Checks per account can be seen on our pricing page.
Can I buy more Advanced Checks?
Yes, you can purchase additional Advanced Checks in My Pingdom. The Advanced Checks are sold in multiples of five (e.g. 5, 10, 15, 20, etc.).
Feedback and support
If you have any questions about our Page Speed service, please check out our FAQ. If that doesn’t answer your questions you are always welcome to contact our support.
We also welcome your feedback; we always love to hear from you.


