So SolarWinds® Pingdom® has alerted you to an issue—what do you do now?
In this article, I’ll explain the features and capabilities of a full monitoring stack in SolarWinds and how you can use it to get to the bottom of a 3 a.m. Pingdom wake-up call.
The Setup
For our web service, we use a simple architecture of a front-end Flask application with a Postgres back end served behind an edge SSL-terminating NGINX instance on the DigitalOcean Managed Kubernetes service.
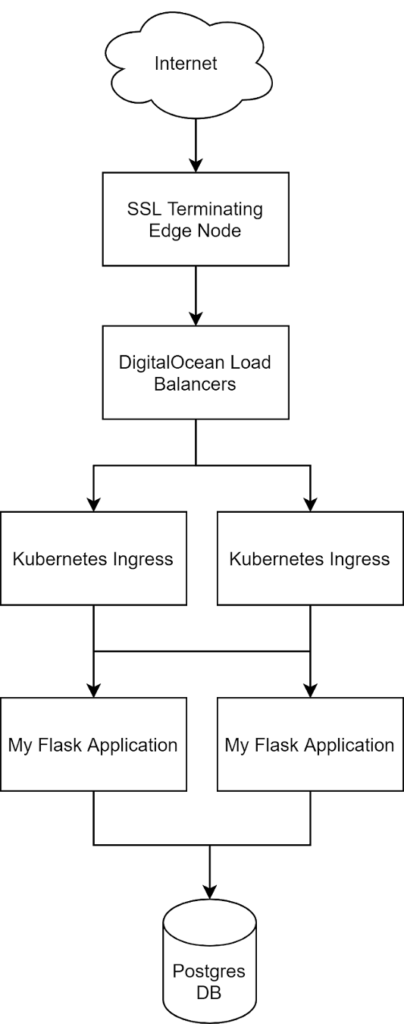
Though this architecture is easy to set up and visualize, this kind of complexity can quickly overwhelm an investigation and give no clear source of alerts or clues. To help us correlate our problem from a single Pingdom alert and nail down the root cause quickly and efficiently, we’ll use two tools from the SolarWinds stack: AppOptics™ for capturing metrics and Loggly® for capturing logs.
Installing each of these tools is beyond the scope of this article, but it’s easy in a DigitalOcean managed cluster. To export the AppOptics metrics, we utilized the SolarWinds agent as a DaemonSet, and for the Loggly logs, we utilized rKubelog, a lightweight Kubernetes log tail application. Both tools are powerful assets and can be used independently, but together, they’re an even more powerful way to quickly get to the root cause of an issue and reduce mean time to resolution (MTTR).
Pingdom: The Alert
In our scenario, we’re using the alerting mechanisms of Pingdom, an externally hosted suite of agents designed to constantly check your site for health and speed.
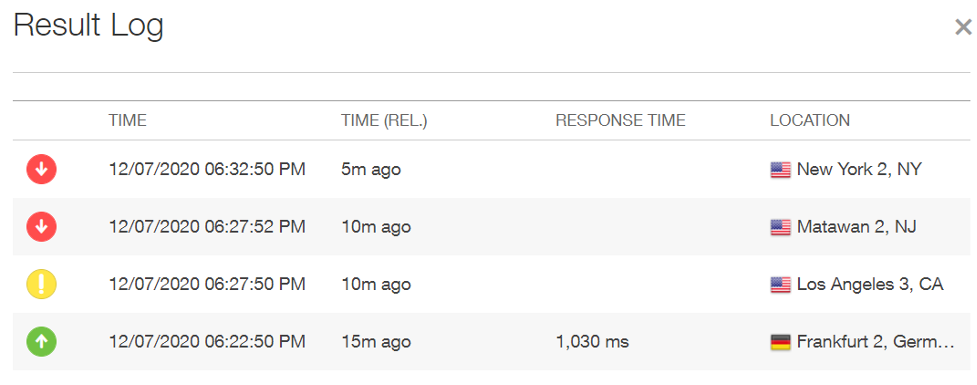
Below is our Pingdom alert dashboard, showing us the events that have triggered our wake-up call over the past several hours.

We can see from our dashboard there are some moments of unavailability in the last few tests, but the cause isn’t clear from this alone.
Based on the information in the Test Log from Pingdom, we can see our performance from several regions across the U.S. has worsened in the last 10 minutes:
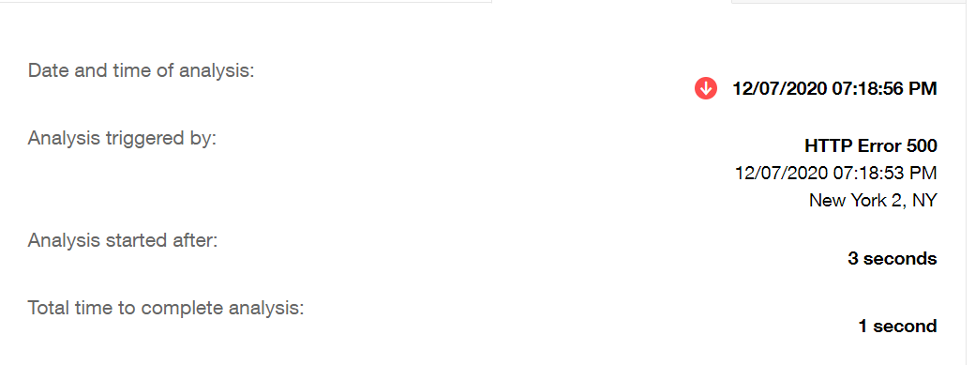
And by clicking through to the root cause analysis section in Pingdom, we can see pretty clearly this is an application-side error (HTTP Error 500). We’ll need to dig into application timelines and logs to understand what we’re looking at.
AppOptics: The Timing
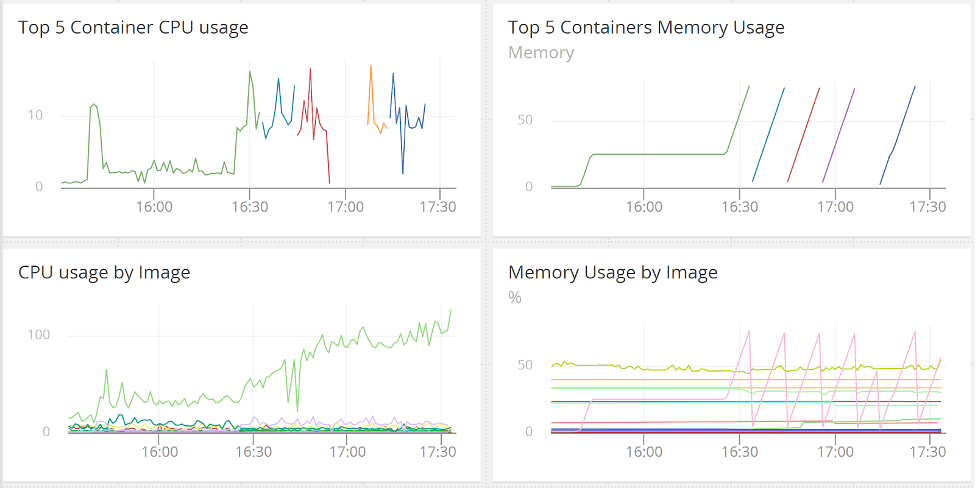
To better understand the scope and timing of our problem, we can look at a simple metric heuristic dashboard AppOptics has provided out of the box with our Docker container monitoring, courtesy of our snap agent.
With AppOptics, we can easily see in the image below one container repeatedly dumps memory (the bottom-right graph) and is high in CPU (the bottom-left graph) with each iteration of container replacement. This tells us at the very least, this one container is struggling with something. It also tells us when this probably started (just before 16:30) and gives us an idea of the kind of impact we might be seeing with this behavior.
Unfortunately, since the application appears to be continuously restarting, we can be sure our customers are constantly seeing application-related failures on our site.
Loggly: The Error Volume
With the information from AppOptics, we have a clear start time and a general idea of what applications or services are seeing the problem. We can now go one step further and use Loggly to filter our logs to this time and service and gain a crystal-clear picture of the errors causing our 500s all the way up at Pingdom.
The Loggly dashboard is an all-inclusive log view, giving us some easy search functionality to dial into what’s causing these trends. In this image, we can see a flood of new events coming into our unfiltered log view.

In general, we can see a large increase in errors. By using the search feature in Loggly to drill down into our filter of errors, we can clearly see our Postgres connector is experiencing unexpected closed connections in large volumes.

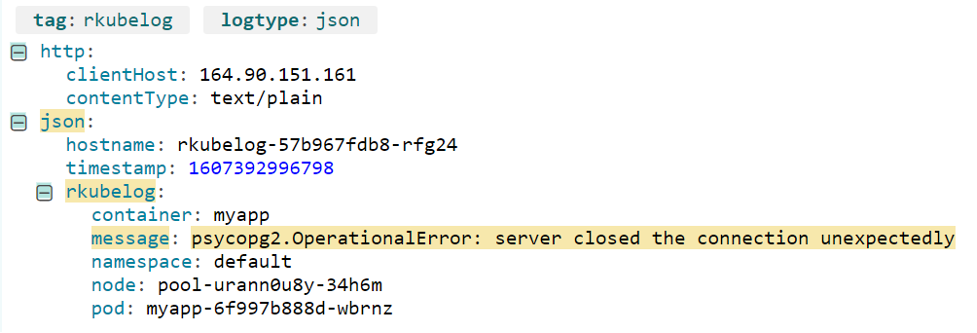
Oddly, there aren’t any errors logged for the database itself. This indicates there may not be an issue with the database at all, leaving only the path between the application and the database as the source of the error.
Now that we fully understand the error causing our alerts and the servers on which it’s happening, we can start working on mitigation. In our case, we know there’s a problem connecting only from our application to this specific database; no other applications or infrastructure appear to have the behavior based on our logs and overall metrics from our tool suites. To attempt a quick mitigation, we might restart the two pods and (hopefully) make the problem magically vanish. But as this is a simulated error, we already know what the problem is and can fast-forward to the cause. In our case, with a little manual testing of network pathing tools, such as traceroute, we can quickly find the latency exists on the database public interface and was caused by a misconfigured network queue.
Using SolarWinds to Find Resolution
To find a problem, it’s necessary to articulate it. The best way to do this is with a connected set of metrics and observability capable of bringing you directly to the originating event. While Pingdom is great for overall availability monitoring, AppOptics has powerful built-in functionality to integrate APM into the application stack, and Loggly provides intuitive and elegant centralized log parsing. Using these tools together provides a steady and scalable workflow for any user.
So before you get another call at 3 a.m., do yourself the favor of laying the groundwork now—while you’re awake—so tired-you can quickly resolve the issue and go back to bed.


