Synthetic Monitoring

Simulate visitor interaction with your site to monitor the end user experience.

View Product Info

FEATURES

Simulate visitor interaction

Identify bottlenecks and speed up your website.

Learn More

Real User Monitoring

Enhance your site performance with data from actual site visitors

View Product Info

FEATURES

Real user insights in real time

Know how your site or web app is performing with real user insights

Learn More

Infrastructure Monitoring Powered by SolarWinds AppOptics

Instant visibility into servers, virtual hosts, and containerized environments

View Infrastructure Monitoring Info
Comprehensive set of turnkey infrastructure integrations

Including dozens of AWS and Azure services, container orchestrations like Docker and Kubernetes, and more 

Learn More

Application Performance Monitoring Powered by SolarWinds AppOptics

Comprehensive, full-stack visibility, and troubleshooting

View Application Performance Monitoring Info
Complete visibility into application issues

Pinpoint the root cause down to a poor-performing line of code

Learn More

Log Management and Analytics Powered by SolarWinds Loggly

Integrated, cost-effective, hosted, and scalable full-stack, multi-source log management

 View Log Management and Analytics Info
Collect, search, and analyze log data

Quickly jump into the relevant logs to accelerate troubleshooting

Learn More

Roller coaster website performance?

Have you ever noticed if your site tends to perform great during part of the day, only to slow down to a crawl at other times? You may be suffering from what we here at Pingdom sometimes call the roller coaster syndrome.

For example, below is a real-world example for the popular social music site Last.fm from the end of February this year. Every spike in this graph occurs in the evening, Central European Time, like clockwork. The graph shows the time it took to load the HTML page.
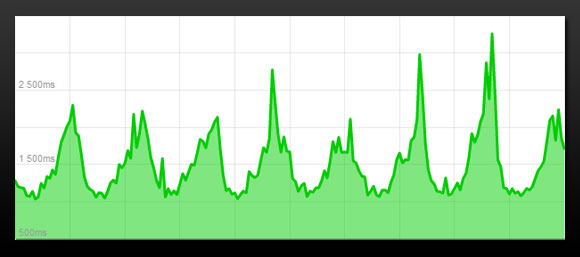
Load time increase every evening
Above: HTML load time for Last.fm late in February.

As you can see, the average time to load the HTML page for Last.fm more than doubled during what we assume is its peak hours.

A website with a vast majority of its visitors coming from a specific region, such as for example just the UK, or Europe, or USA, may find the performance of its website looking more or less like a roller coaster every day, just as the Last.fm example.

It’s even easier to see if you average the hours of the day over a longer time period, such as here below (which is generated from the same data and time period as the graph above):
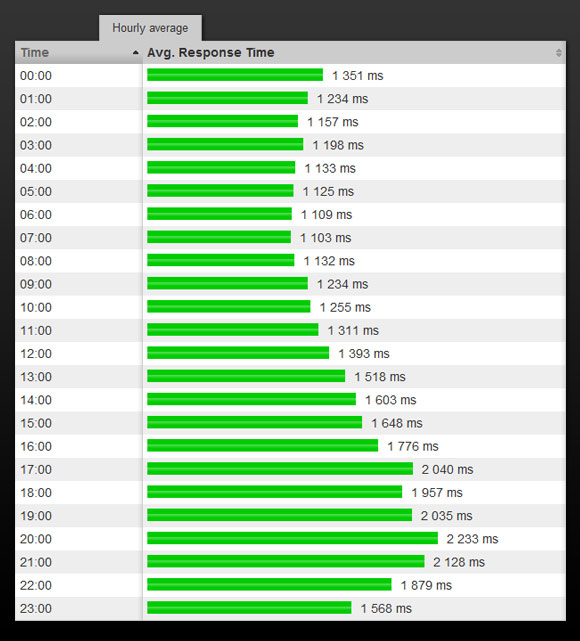
Average response time per hour
Above: Since this diagram is an average of several days, the more dramatic peaks of the graph have been smoothed out a bit, but in return we get a clear view of where the general “problem areas” are.

Looking at the graph, together with this diagram, leads us to believe that Last.fm may have a predominantly European audience.

Here you can easily see that the load time peaks at 20:00-21:00 CET. As can be expected if the majority of the users are European, the load on the site seems to be significantly lower during night time and early morning.

(We would like to point out that Last.fm has improved the performance of their site significantly in the last couple of months, and you can no longer see this roller coaster behavior.)

It should be mentioned that similar patterns can also be found in cases where for example daily backups or other scripts are run at certain hours, slowing down server performance while they are running.

So what does this mean? It means you should keep a close eye on your website’s performance during peak hours. Not only is that when your website will be at its slowest, it is when you have the most users (so making a good impression is a very good idea). If you see your website start having this kind of roller coaster performance, then it is time to start thinking about scaling it up.

The screenshots above are taken from Pingdom.

Introduction to Observability

These days, systems and applications evolve at a rapid pace. This makes analyzi [...]

Webpages Are Getting Larger Every Year, and Here’s Why it Matters

Last updated: February 29, 2024 Average size of a webpage matters because it [...]

A Beginner’s Guide to Using CDNs

Last updated: February 28, 2024 Websites have become larger and more complex [...]

The Five Most Common HTTP Errors According to Google

Last updated: February 28, 2024 Sometimes when you try to visit a web page, [...]

Page Load Time vs. Response Time – What Is the Difference?

Last updated: February 28, 2024 Page load time and response time are key met [...]

Monitor your website’s uptime and performance

With Pingdom's website monitoring you are always the first to know when your site is in trouble, and as a result you are making the Internet faster and more reliable. Nice, huh?

START YOUR FREE 30-DAY TRIAL

MONITOR YOUR WEB APPLICATION PERFORMANCE

Gain availability and performance insights with Pingdom – a comprehensive web application performance and digital experience monitoring tool.

START YOUR FREE 30-DAY TRIAL
Start monitoring for free