Synthetic Monitoring

Simulate visitor interaction with your site to monitor the end user experience.

View Product Info

FEATURES

Simulate visitor interaction

Identify bottlenecks and speed up your website.

Learn More

Real User Monitoring

Enhance your site performance with data from actual site visitors

View Product Info

FEATURES

Real user insights in real time

Know how your site or web app is performing with real user insights

Learn More

Infrastructure Monitoring Powered by SolarWinds AppOptics

Instant visibility into servers, virtual hosts, and containerized environments

View Infrastructure Monitoring Info
Comprehensive set of turnkey infrastructure integrations

Including dozens of AWS and Azure services, container orchestrations like Docker and Kubernetes, and more 

Learn More

Application Performance Monitoring Powered by SolarWinds AppOptics

Comprehensive, full-stack visibility, and troubleshooting

View Application Performance Monitoring Info
Complete visibility into application issues

Pinpoint the root cause down to a poor-performing line of code

Learn More

Log Management and Analytics Powered by SolarWinds Loggly

Integrated, cost-effective, hosted, and scalable full-stack, multi-source log management

 View Log Management and Analytics Info
Collect, search, and analyze log data

Quickly jump into the relevant logs to accelerate troubleshooting

Learn More

Where NOT to keep your servers according to Mother Nature

If Mother Nature has anything to say, there simply are some places where you shouldn’t place a data center. Do you really want to have your servers where there is a high risk of earthquakes, tornadoes or hurricanes? We didn’t think so…

It seems that the U.S. is “blessed” not only with large areas where the likelihood of earthquakes is very high, but also with some very harsh weather conditions in the form of hurricanes (no one is going to forget Katrina) and tornadoes, the most violent weather phenomenon in nature. Power outages, breakdown of infrastructure and loss of lives follow in the tracks of these hazardous monstrosities of nature.

We decided to look at heat maps for earthquakes, hurricanes and tornadoes in the U.S. to see exactly where the danger areas were located. In addition to that we also composited them to see get the full picture.
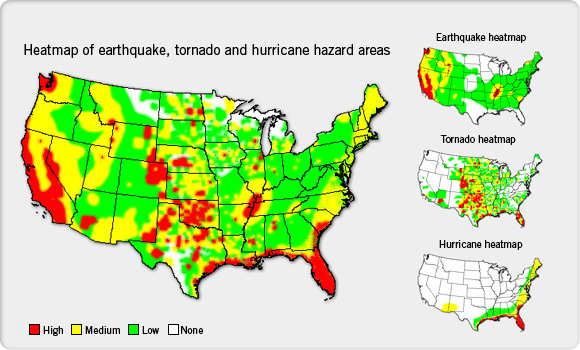
Heat map of earthquake, hurricane and tornado hazard areas

States with large areas where there is either a very high risk of hurricanes, tornadoes or earthquakes are California, Florida, Washington, Arkansas, Texas, Colorado, Nebraska, South Carolina, Louisiana, Arizona, New Mexico.

If your biggest worry is weather, Florida has a very high risk of both hurricanes and tornadoes. If your biggest worry is earthquakes, California has been waiting for The Big One for quite some time now (hopefully not this bad, though). Silicon Valley is resting on wobbly ground.

There are a few areas in Montana, North Dakota, Minnesota, Wisconsin, Michigan and Texas where none of the three heat maps overlap. There may of course be other dangers aside from those we listed here.

We are not saying that everyone should move to Montana, but if you take earthquakes, hurricanes and tornadoes into account, you might want to keep your data center (or servers in general) outside the “red zones” of the map.

Sources: Data from U.S. Geological Survey, National Hurricane Center and National Climatic Data Center. Heat maps can be found here: Earthquake heat map, hurricane heat map, tornado heat map.
Introduction to Observability

These days, systems and applications evolve at a rapid pace. This makes analyzi [...]

Webpages Are Getting Larger Every Year, and Here’s Why it Matters

Last updated: February 29, 2024 Average size of a webpage matters because it [...]

A Beginner’s Guide to Using CDNs

Last updated: February 28, 2024 Websites have become larger and more complex [...]

The Five Most Common HTTP Errors According to Google

Last updated: February 28, 2024 Sometimes when you try to visit a web page, [...]

Page Load Time vs. Response Time – What Is the Difference?

Last updated: February 28, 2024 Page load time and response time are key met [...]

Monitor your website’s uptime and performance

With Pingdom's website monitoring you are always the first to know when your site is in trouble, and as a result you are making the Internet faster and more reliable. Nice, huh?

START YOUR FREE 30-DAY TRIAL

MONITOR YOUR WEB APPLICATION PERFORMANCE

Gain availability and performance insights with Pingdom – a comprehensive web application performance and digital experience monitoring tool.

START YOUR FREE 30-DAY TRIAL
Start monitoring for free