Now you can finally find out why a website loads so slowly. Is it that huge banner, or because the site is using more than 300 images?
Pingdom Tools is meant to be a great set of utilities for webmasters and other curious web dwellers. First out is the Full Page Test, a tool for analyzing website load times. It also allows you to see exactly what is included on a page, and since the tool uses AJAX you get immediate feedback.

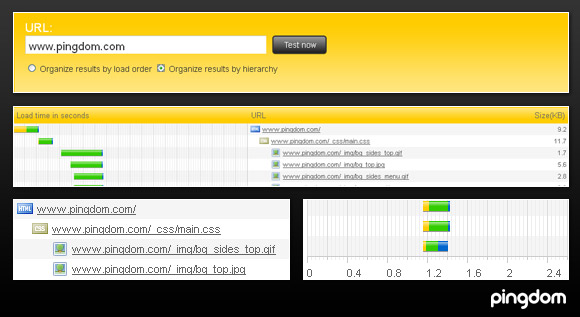
Above: Partial screenshots of a test in progress. You can find screenshots of tests on various websites over at Flickr. Or you can just get right to the action.
How does it work?
The Full Page Test mimics the way a web browser loads a website. It will load the HTML page and all the objects in it, such as images, CSS files, scripts, Flash files, frames/iframes, etc. You can view the type, size and load time of every object. It will even parse objects inside CSS files.
To make it easy to view the objects, they can be shown in either load order or as a clearly ordered hierarchy. As a bonus, broken links to objects will be marked red. They are more common than you might think.
We allow pages up to 5 MB in size to be loaded, and a maximum of 500 objects per page. Requests will time out after 30 seconds.
This is version one of the Full Page Test. It’s already a great tool, but just wait until you see what we have in store for the future.
The future of Pingdom Tools
Pingdom Tools is currently running on one dedicated server, but we will add more servers and features down the line. The Full Page Test is just the first of several tools that will be launched under the Pingdom Tools umbrella. Pingdom Tools is meant as a complement to the Pingdom uptime monitoring service, but is freely available to the public. It’s also a great place for our own developers to experiment with cool ideas and features.
The Pingdom Full Page Test was inspired by the OctaGate SiteTimer. We really liked the idea but wanted to take it one step further. One of our developers built this in two weeks (thank you Nenad).


