On Tuesday we launched a brand new control panel and also our new alerting system BeepManager. We migrated you together with around 500,000 other customers to the new system, and also converted contacts to Pingdom users to enable full functionality for you. With every large change, as this one was, no matter how much you prepare there is always a risk for a few unforeseen incidents.
Since launching we have been really busy listening to the feedback from our customers. And in retrospect we could have done some things better, and we are sorry for the sudden and big change this has been for you.
Having said that, we are very happy that so many of you are using and loving BeepManager. And we want to share the improvements we have made since the launch, and what we are working right now to improve it even further.
◼ Done
◼ In progress
◼ Planned
- Enable option to have the old alert templates back. (FAQ article)
This means you get the Check-ID and hostname added to the the subject line of the alerts - A lot of fixes resulting in a new Dashboard, with functionality reminding of the old look and feel.
See separate images and explanations below. - We fixed a bug so that CC assignees receive a notification when an incident is closed.
- Fixed API errors.
- We added a help icon to all pages on My Pingdom.
And linking further information to the related FAQ page. - We added better granularity when choosing time range for contact methods on Alerting Users.
Used to be in 5 minute interval, now you can choose the first 5 minutes in 1 minute intervals. - Enable Users to be created with Legacy Alerting format.
- Corrected Maintenance Schedule behavior when sending alerts.
- Added contextual information to WebHooks, Check name, hostname.
- To the delight of many of you we are re-enabling the legacy Contact functionality for a simpler notification setup. This feature will be enabled tomorrow (Friday) for all customers.
This is a major change that lets you use the Pingdom service without BeepManager at all.
- Clearly mark what is your main account, and what is a user’s account.
You should always log in to your main account. We will put extra effort into making the different accounts super clear and also send out an email regarding this. - Enable the option to turn off bulk/summary alerts in one message.
- Enable a tab to search and filtering in tables for all check types.
- Plus a lot more features and functionalities planned for the upcoming days and weeks.
The Dashboard
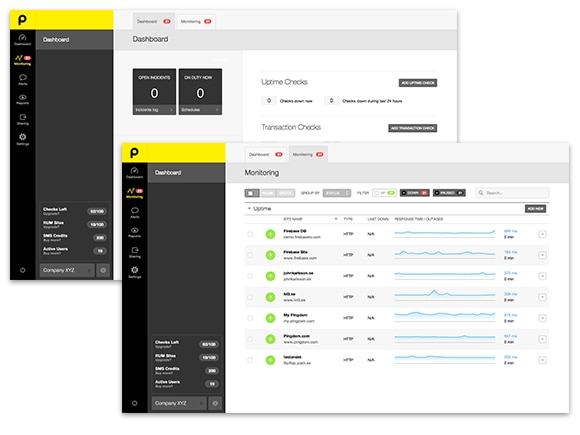
Look and feel a lot more similar to the old dashboard. You certainly gonna find the improvements really helpful.

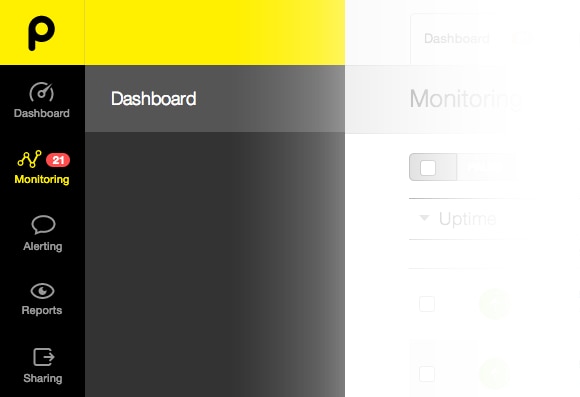
The menu has clear labels for each section, and a small notification for monitoring showing the number of checks down.
Numbers added tomorrow morning

Dashboard has two tabs Dashboard (shows number of active incidents in red notification) and Monitoring (shows number of checks that are down in red).

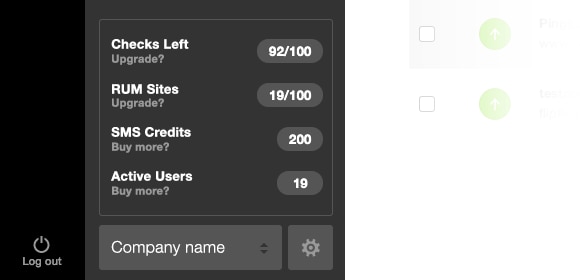
The information in the boxes for “checks left” etc is moved to the sidebar so that the user can focus on monitoring information.

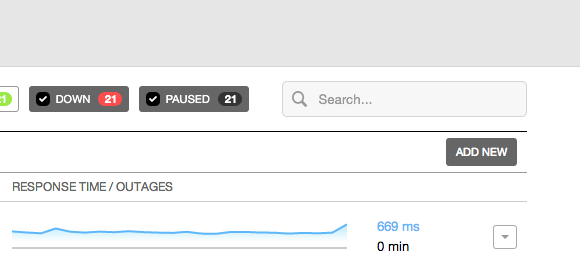
Filtering buttons has been made more clear, making it easier to see what is filtered. Also adding color to the numbers for emphasis.

Contextual search is moved to the list. Here you can search and filter text, tags like before. We are also adding autocomplete and type-ahead.
Search will be deployed tomorrow morning

Lessons learned
When launching new products there are always lessons to be learned, and you try to avoid making any mistakes. We have learned a lot over the last days, mostly thanks to fantastic input from you, our customers, on how you use our services.
As planned, since we have 500,000 customers and this was a big change, we are working around the clock now in 3 shifts. We are helping our customers through our Support team, as well as working fast with improvements, to things we discovered or wasn’t intuitive to understand for everyone.
Feedback
In the upcoming weeks we will continue to focus on listen to our customers, and analyze how you use our services to improve them even further.
We want to hear from you with suggestions how this can be an even better service. You can always email us at support@pingdom.com. Please provide us with descriptive suggestions, comments and possibly even screenshots so we can understand how you experience the service.
We strive to being a leading actor in monitoring, and we sincerely apologize for any inconvenience you may have had. We are here for you, and we value your feedback which is so important in order for us to move forward.
Sincerely,
The entire Pingdom team


