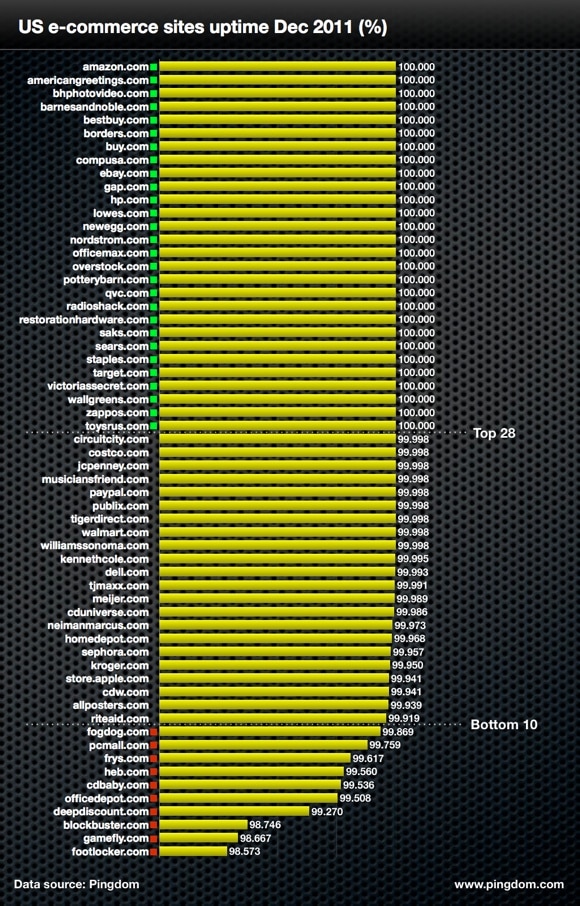
 Out of the 59 US-based e-commerce sites we monitored during the holiday season last year 28 scored a perfect 100% uptime for December.
Whether this helped spur on the booming sales in the US, we don’t know, but retail e-commerce spending in the US reached $37.2 billion for the November to December 2011 period. That was an increase of 15% from the same period in 2010.
We decided to dig into the numbers for these e-commerce sites to see how well they did in terms of uptime and performance. After massaging the data coming from our Pingdom probes, it turns out that the sites overall performed well during December 2011 in terms of uptime, but response time was an issue for several sites.
Uptime per site
Out of the 59 sites we monitored, 28 show a perfect 100% uptime score with no downtime at all recorded by the Pingdom monitoring probes.

Notable outages included footlocker.com, which experienced an outage lasting 4 hours and 46 minutes on December 21, resulting in the lowest uptime in our study, 98.573%. Gamefly.com was not far behind with an outage of 4 hours and 44 minutes on December 16. Officedepot.com saw an outage of 3 hours and 15 minutes on December 4. For the rest of the sites in the bottom 10 for uptime during December 2011, their outages were short and distributed over the month.
Response time per site
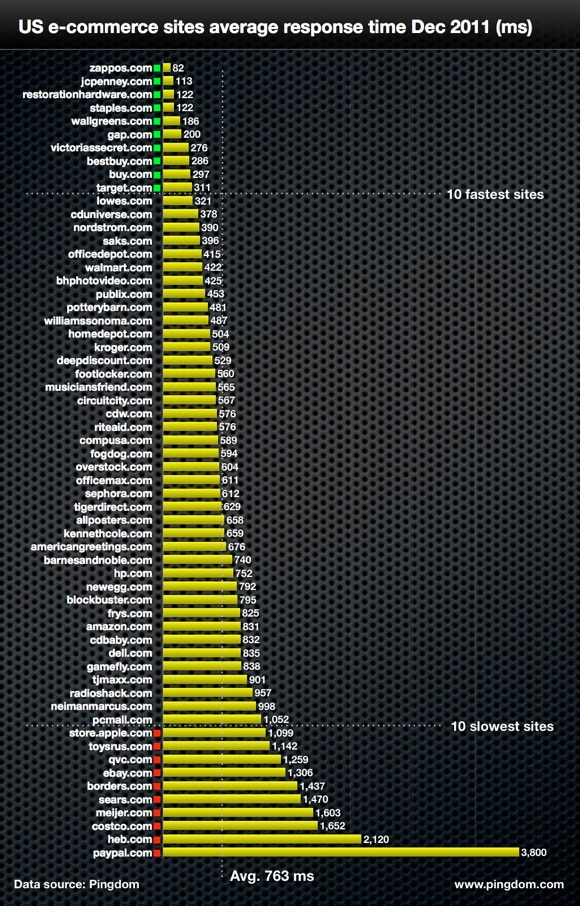
When we ranked the sites according to average response time during December 2011, the picture doesn’t change all that much. All the sites in the top 10 in terms of average response time also had 100% uptime, except jcpenney.com, which had a 99.998% uptime.

One site that clearly sticks out, and not in a good way, is paypal.com. Even after thoroughly investigating why it had an average response time of 3,800 ms during December last year, we can’t find any other reason than that the site is just that slow. And note that paypal.com scored a 99.998% uptime during December.
Response time per day
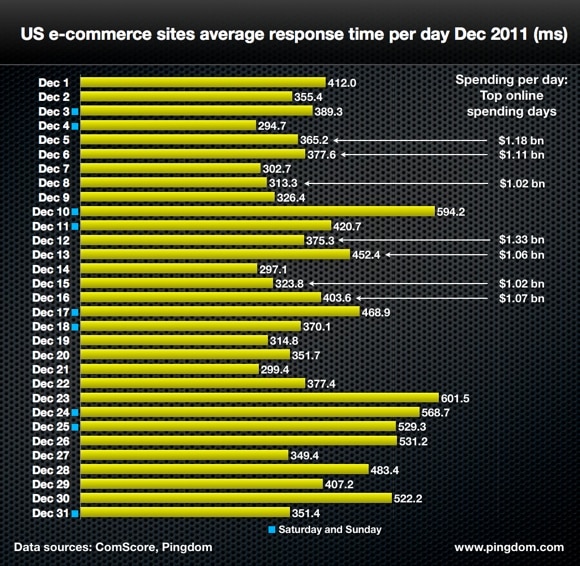
According to ComScore, December 2011 had seven days that saw online sales above $1 billion per day. We were wondering if increased traffic on those seven days meant slower response time from the e-commerce sites. Here’s what it looks like when we calculate the average response time for all sites in our study for each day, in December 2011.

As you can see, there is no apparent relationship between how much was sold on a particular day and the average response time. There are also no sudden and major shifts in average response times, with two exceptions:
- December 9 to 10: We can’t find any particular reason for this being a busy online shopping time.
- December 22 to 23: December 23 was the last day customers in the US could place orders and have the goods delivered on time for Christmas. A last-minute rush to order things may explain the increase in response time.
This means there is no support for the notion that just because lots of goods and services are being sold, sites will deliver slower response times.
In fact, the average response time per day in December 2011 was 404 ms, and the average response time per day for the top 7 days in terms of online spending was 402 ms.
All in all, a good month for e-commerce
The monitoring of these sites continues, and we’re sure to return with another report in the future. We also add to and adapt the list of sites on a continuous basis, to be able to give you the most up-to-date and relevant results. We can help you with website monitoring for your own site.
In this study, we were pleasantly surprised that 50% of the sites scored a perfect 100% uptime, and many of the sites also showed an impressive response time performance.
Did you do an online shopping during the holiday season last year? Were you annoyed or perhaps even disrupted by a slow site or a site that was down? Share your experience in the comments.


