Synthetic Monitoring

Simulate visitor interaction with your site to monitor the end user experience.

View Product Info

FEATURES

Simulate visitor interaction

Identify bottlenecks and speed up your website.

Learn More

Real User Monitoring

Enhance your site performance with data from actual site visitors

View Product Info

FEATURES

Real user insights in real time

Know how your site or web app is performing with real user insights

Learn More

Infrastructure Monitoring Powered by SolarWinds AppOptics

Instant visibility into servers, virtual hosts, and containerized environments

View Infrastructure Monitoring Info
Comprehensive set of turnkey infrastructure integrations

Including dozens of AWS and Azure services, container orchestrations like Docker and Kubernetes, and more 

Learn More

Application Performance Monitoring Powered by SolarWinds AppOptics

Comprehensive, full-stack visibility, and troubleshooting

View Application Performance Monitoring Info
Complete visibility into application issues

Pinpoint the root cause down to a poor-performing line of code

Learn More

Log Management and Analytics Powered by SolarWinds Loggly

Integrated, cost-effective, hosted, and scalable full-stack, multi-source log management

 View Log Management and Analytics Info
Collect, search, and analyze log data

Quickly jump into the relevant logs to accelerate troubleshooting

Learn More

Windows 7 just overtook XP in the United States

Microsoft WindowsIt’s finally happened. After a long reign at the top, Microsoft’s Windows XP is no longer the most widely used desktop operating system in the United States, instead turning the crown over to Windows 7.

As of April, Windows 7 has 31.71% of the desktop operating system market, compared to 31.56% for Windows XP.

Here is the current distribution of desktop operating systems in the United States, based on the first seven days of April:

Desktop OS market share, United States, April 2011

The data is from StatCounter and consists of aggregated visitor stats from more than three million websites. In other words, this reflects the market share distribution of computers used to access the Web.

The rapid rise of Windows 7 has been a massive success after Microsoft’s relative failure with Windows Vista (which never got the upper hand on XP). Since its launch in October 2009, the rise of Windows 7 has been straight as an arrow.

Desktop OS market share over time, United States

Windows XP is still a big presence, especially in the corporate space where many have resisted upgrading, but Windows 7 seems to finally have set the upgrade train rolling.

What about the rest of the world?

Worldwide, Windows 7 has a market share of 31.17%, while Windows XP still holds a significant 46.87% (now in April).

However, this doesn’t mean the United States is the only country where Windows 7 has overtaken Windows XP. There are actually a number of countries where this has already happened, sometimes several months ago. A few examples:

  • United Kingdom
  • Canada
  • Australia
  • France
  • Germany
  • Belgium
  • Denmark
  • Finland
  • Netherlands
  • Norway
  • Sweden

So in this sense, the United States actually turns out to be a bit behind the curve.

Introduction to Observability

These days, systems and applications evolve at a rapid pace. This makes analyzi [...]

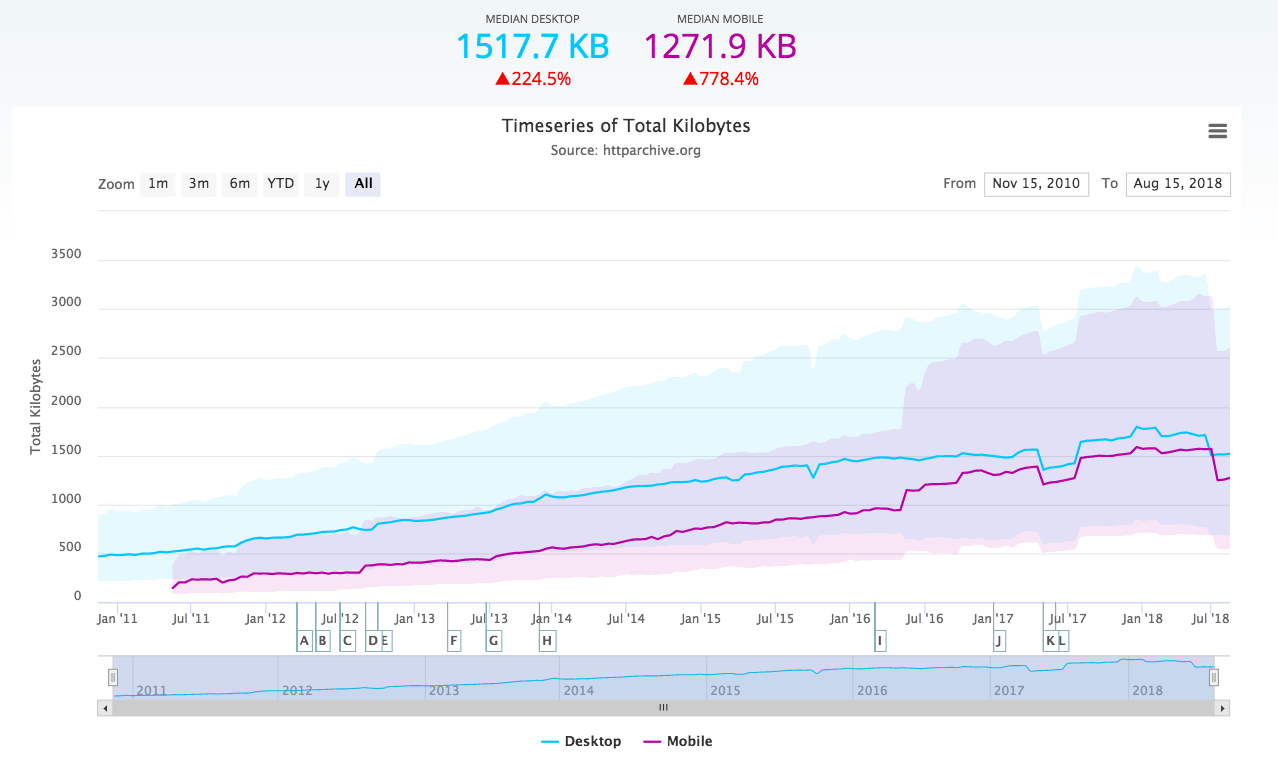
Webpages Are Getting Larger Every Year, and Here’s Why it Matters

Last updated: February 29, 2024 Average size of a webpage matters because it [...]

A Beginner’s Guide to Using CDNs

Last updated: February 28, 2024 Websites have become larger and more complex [...]

The Five Most Common HTTP Errors According to Google

Last updated: February 28, 2024 Sometimes when you try to visit a web page, [...]

Page Load Time vs. Response Time – What Is the Difference?

Last updated: February 28, 2024 Page load time and response time are key met [...]

Monitor your website’s uptime and performance

With Pingdom's website monitoring you are always the first to know when your site is in trouble, and as a result you are making the Internet faster and more reliable. Nice, huh?

START YOUR FREE 30-DAY TRIAL

MONITOR YOUR WEB APPLICATION PERFORMANCE

Gain availability and performance insights with Pingdom – a comprehensive web application performance and digital experience monitoring tool.

START YOUR FREE 30-DAY TRIAL
Start monitoring for free