Synthetic Monitoring

Simulate visitor interaction with your site to monitor the end user experience.

View Product Info

FEATURES

Simulate visitor interaction

Identify bottlenecks and speed up your website.

Learn More

Real User Monitoring

Enhance your site performance with data from actual site visitors

View Product Info

FEATURES

Real user insights in real time

Know how your site or web app is performing with real user insights

Learn More

Infrastructure Monitoring Powered by SolarWinds AppOptics

Instant visibility into servers, virtual hosts, and containerized environments

View Infrastructure Monitoring Info
Comprehensive set of turnkey infrastructure integrations

Including dozens of AWS and Azure services, container orchestrations like Docker and Kubernetes, and more 

Learn More

Application Performance Monitoring Powered by SolarWinds AppOptics

Comprehensive, full-stack visibility, and troubleshooting

View Application Performance Monitoring Info
Complete visibility into application issues

Pinpoint the root cause down to a poor-performing line of code

Learn More

Log Management and Analytics Powered by SolarWinds Loggly

Integrated, cost-effective, hosted, and scalable full-stack, multi-source log management

 View Log Management and Analytics Info
Collect, search, and analyze log data

Quickly jump into the relevant logs to accelerate troubleshooting

Learn More

Pingdom in numbers: 37 billion site tests so far this year

PingdomOur server infrastructure has a lot of work to do, it’s quite a busy bee. When you monitor the uptime and response time of as many websites and servers on the Internet as we do, and do it on a continuous basis, the numbers quickly add up. Just for fun, we thought we’d share some of these numbers with you.

First a couple of year-to-date numbers for the Pingdom monitoring network:

  • Tests performed so far this year: 37 billion
  • Alerts sent out so far this year (all alerts to all contacts): 31 million

The alert number is the sum of all alerts via email, SMS, Twitter, iPhone push notifications, etc.

And what about right now? Here is a snapshot of our current hourly workload:

  • Tests performed per hour: 6.5 million
  • Average # of alerts sent out per hour (all alerts to all contacts): 6,100

We process and save every individual test result for you, with redundant data storage to keep it safe. And of course, there’s plenty of other monitoring-related data to handle on top of that. It all adds up:

  • Storage used for historical monitoring data: 23 terabyte

All of these numbers are growing rapidly. New people (and companies) keep joining Pingdom to monitor their sites, and many of our existing users decide to monitor more of their services.

Finally, a small note on our monitoring network: We currently monitor from more than 30 locations, a number that will go up significantly over time as our network expands geographically. Pingdom users can always see an up-to-date list of monitoring locations and servers under “active probe servers” in our control panel.

We hope you found these numbers interesting. We’re admittedly not operating on the scale of Facebook or Google, but these days, who does? We’ll get there eventually… 😉

Introduction to Observability

These days, systems and applications evolve at a rapid pace. This makes analyzi [...]

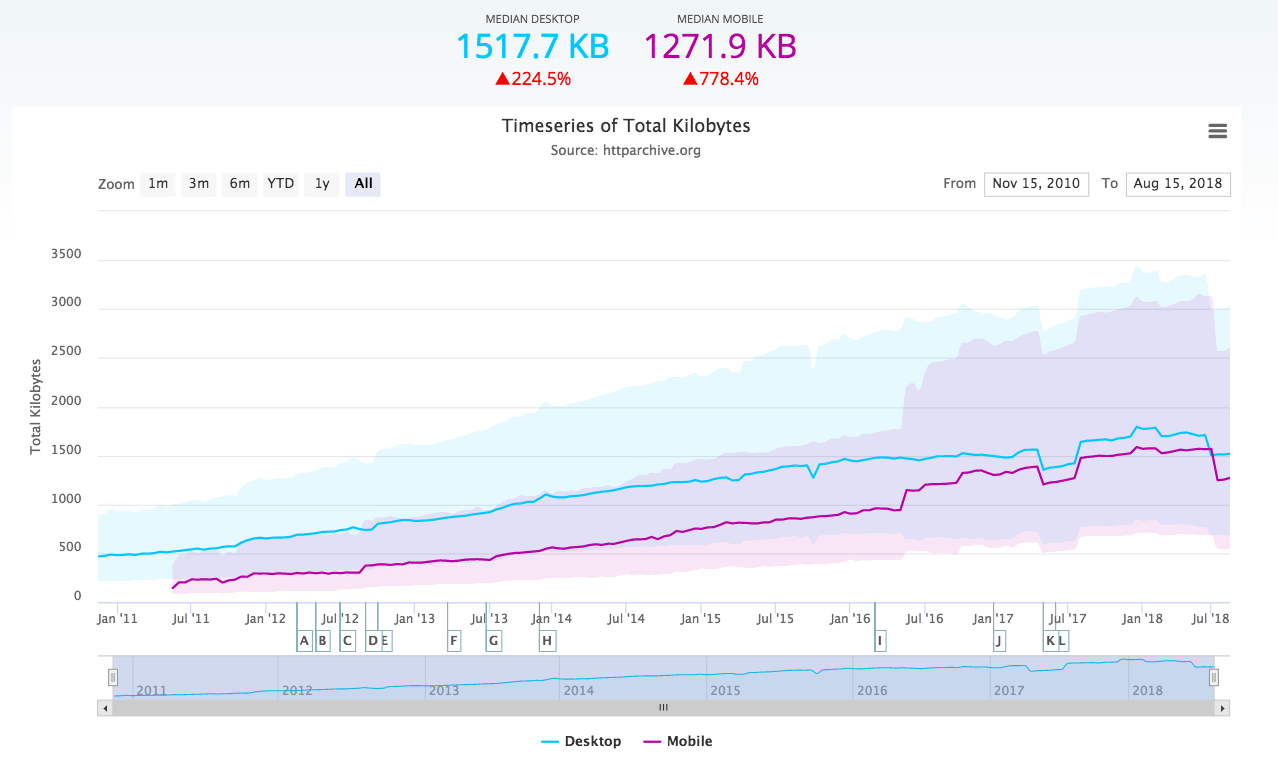
Webpages Are Getting Larger Every Year, and Here’s Why it Matters

Last updated: February 29, 2024 Average size of a webpage matters because it [...]

A Beginner’s Guide to Using CDNs

Last updated: February 28, 2024 Websites have become larger and more complex [...]

The Five Most Common HTTP Errors According to Google

Last updated: February 28, 2024 Sometimes when you try to visit a web page, [...]

Page Load Time vs. Response Time – What Is the Difference?

Last updated: February 28, 2024 Page load time and response time are key met [...]

Monitor your website’s uptime and performance

With Pingdom's website monitoring you are always the first to know when your site is in trouble, and as a result you are making the Internet faster and more reliable. Nice, huh?

START YOUR FREE 30-DAY TRIAL

MONITOR YOUR WEB APPLICATION PERFORMANCE

Gain availability and performance insights with Pingdom – a comprehensive web application performance and digital experience monitoring tool.

START YOUR FREE 30-DAY TRIAL
Start monitoring for free