As you might have noticed, we’re making a new control panel for Pingdom. You can already access parts of it either by logging in directly to it, or going via our current control panel.
We thought you might enjoy a few tips on how you can use it effectively, so let’s start with a very important subject: troubleshooting downtime. After all, once you’ve received an alert from us that your website is down, you might want to have a closer look at exactly what the problem is.
As an added benefit, much of what we tell you here below are things you can apply in the existing control panel, so you practically get two lessons for the price of one. Neat, huh?
Three steps to troubleshooting outages
To begin, go to the uptime report for the check (monitored site) that is or was down.
The uptime report (specifically the status table)
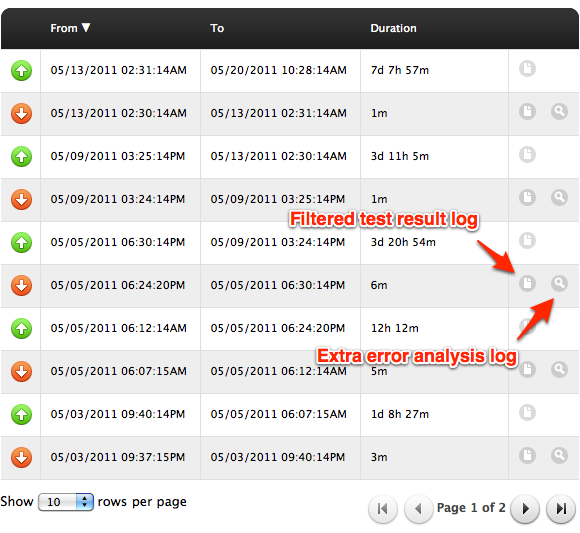
The status table in the uptime report will show you a list of your outages, how long they lasted, and give you a nice starting point for troubleshooting that downtime with direct links to relevant logs, filtered to show you what’s important.

If you click on the icon for the test result log that we’ve marked above, you’ll be transported to a pre-filtered version of that log, showing only the relevant time frame of the outage. See below.
The test result log (filtered)
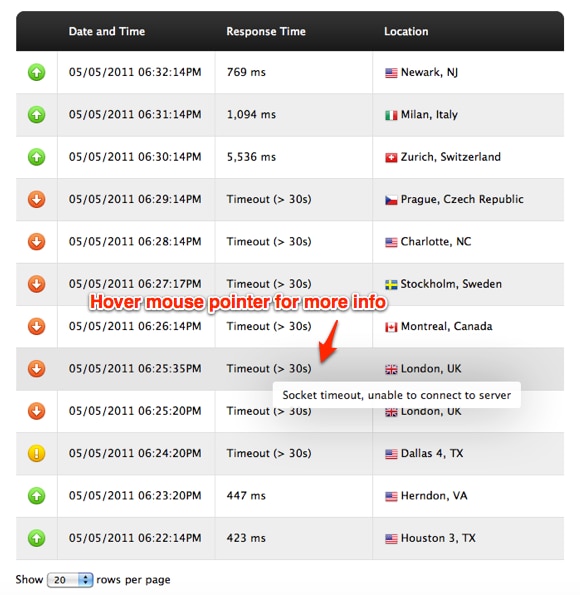
As you can see, the test result log shows the results for all the individual tests we perform on your site. Note that you can see why we considered your site to be down (in this case a connection timeout).

This is actually not that different from the detailed log in the current control panel, but the filtering when you go to the test result log is more aggressive, so it will only show you the results for that specific outage, plus a couple of results just before and after. This is a great first step to find out why an outage happened.
Usually, the test result log will tell you all you need to know. If you for some reason want to dive deeper, you can have a look at the error analysis that was performed when we detected the outage. (Again, go via the status table in the uptime report.)
The error analysis
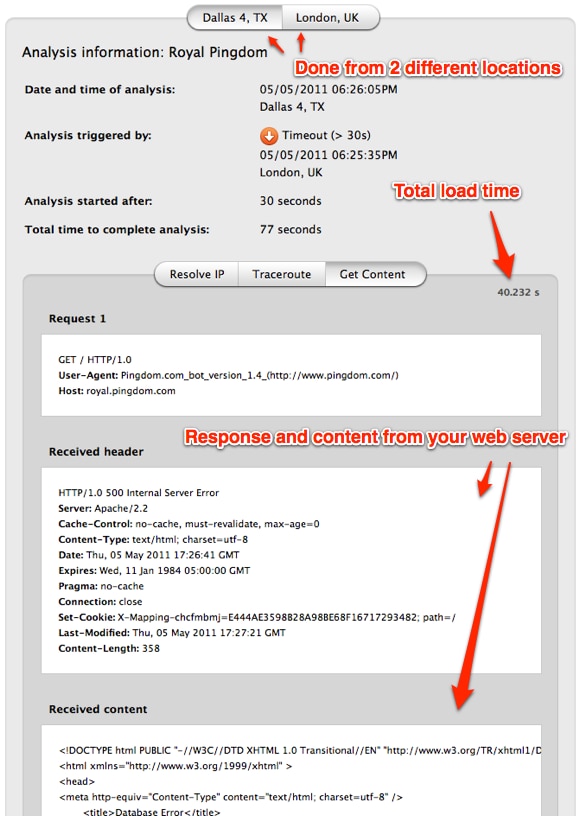
The error analysis is triggered by an outage and tries to load your web page for a much longer time (up to 180 seconds instead of 30) and also logs every HTTP request and the content of the responses we get from your web server. It can be highly useful and give you plenty of additional clues as to what’s behind the problem.

In this specific case we can see that the reason the site timed out for us was because it took 40 seconds to load (we consider anything that takes more than 30 seconds to load as down). We can also see that it would have been considered down anyway, because once the response from the web server finally came back, it was an HTTP 500 error (internal server error), which we also consider as down. In this specific case we even see the site’s error page content, referencing a database error.
That’s pretty good, isn’t it? All in all, this took us less than a minute to find out.
Summary of downtime troubleshooting in Pingdom
This is a pretty useful list to go by:
- View outages in the status table in the uptime report.
- Via the status table, click on the result log icon to view individual test results and see why we considered your site to be down.
- If you want to dive deeper, click on the error analysis icon (via the status table).
Bonus tip: Take advantage of the fact that you’re in a web browser, and open up the links in new tabs so you can quickly jump between them, viewing the problem from different angles.
There you go. You’re well on your way to becoming a Pingdom power user. 😉
Make your voice heard
Don’t forget that we have a feedback widget included in the new control panel. Use it! Let us know what you think. Your feedback will help us make the new control panel even better. And since it’s currently under development, this is a very good time to give feedback.


