Downtime and Root Cause Analysis
"Pingdom says my website is down" - this tutorial will explain why. We will also have a look at the root cause analysis that tells you what caused an outage.
Product
Uptime monitoring
Tags
Root Cause Analysis
What happens if you get an alert that says your website is down but you’re sure that it’s up and running? Here’s how to figure it out where your problem originated.
When one of our probe servers can't connect, or if it receives a HTTP error code, a second server will immediately perform the same test from a different location. An outage or downtime will only be logged if this second opinion confirms that there is an issue. This basically removes the risk of false positives.
Click Reports, followed by Uptime Reports.
Here you’ll find the time interval when your site was down, highlighted in red.
There are two kinds of reports. The icon to your far right gives you a basic overview where you can see which of our servers that were unable to connect or received an error from your site. This data is pulled directly from the test result which logs each individual test done towards the site.
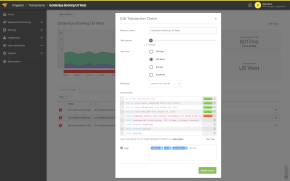
The other icon will give you comprehensive information. Here you’ll find the Root Cause Analysis that helps you to find out what caused an outage.
Resolve IP tests if the given hostname actually corresponds to an IP address. Any DNS error will show up here
Here, you see how long it took from when the incident started until the analysis was completed. The time interval can depend on the kind of incident. A short time interval most likely indicates a status code error. A longer time interval indicates network congestion or slow load time. Anything over 30 seconds will trigger a Timeout outage.
By tracking all network hops between our probe servers and the website that you monitor, the Traceroute is a complementary tool that can help you steer in the right direction. Of course, this depends on if the network and hosting providers allows for traceroutes.
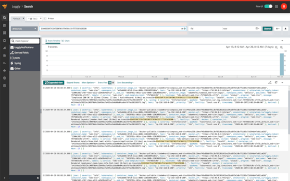
The GET content shows the html code and http headers that respond to our servers. If the web page has redirects, all of them will show until the final page is accessed and a page with a 200 OK status is reached.
Now, this depends on both the site and the type of error that Pingdom has detected. For example, a timeout event can show the entire HTML of the site, which might look normal, but the issue can be the load time and not the content itself. If the issue is a HTTP status code other than a 200 OK, you’ll see the content. If the issue has to do with the connection, no content will be shown, since our servers were not able to connect to your site.
To make things easier to view, you can click Show code in new window.
Show page gives you the opportunity to see how the HTML of the site looks like so you easily can spot any discrepancies.
The test is performed from both the server that first noticed the problem and another one to make a second opinion. That presents you with two different trace routes to compare. Just click the tabs. Clock icons make it easier to find the times you need to investigate further. We wish you lots of green time.
When the check it saved, it will be shown in grey. Don’t worry. This icon will turn green, indicating that everything is running smoothly, but it takes a while the first time you set up a new check so come back after a few minutes or so. After that, tests are performed according to the test interval you chose.
Try it free for 30 days
Start monitoring your website's availability
START 30-DAY FREE TRIALGet started now and you can cancel any time.


